Great Hill Pond — Shoreline & Water Quality Observation Log
Chronological field and laboratory documentation tracking pre-treatment baseline conditions against immediate and secondary post-treatment environmental impacts following chemical herbicide applications.
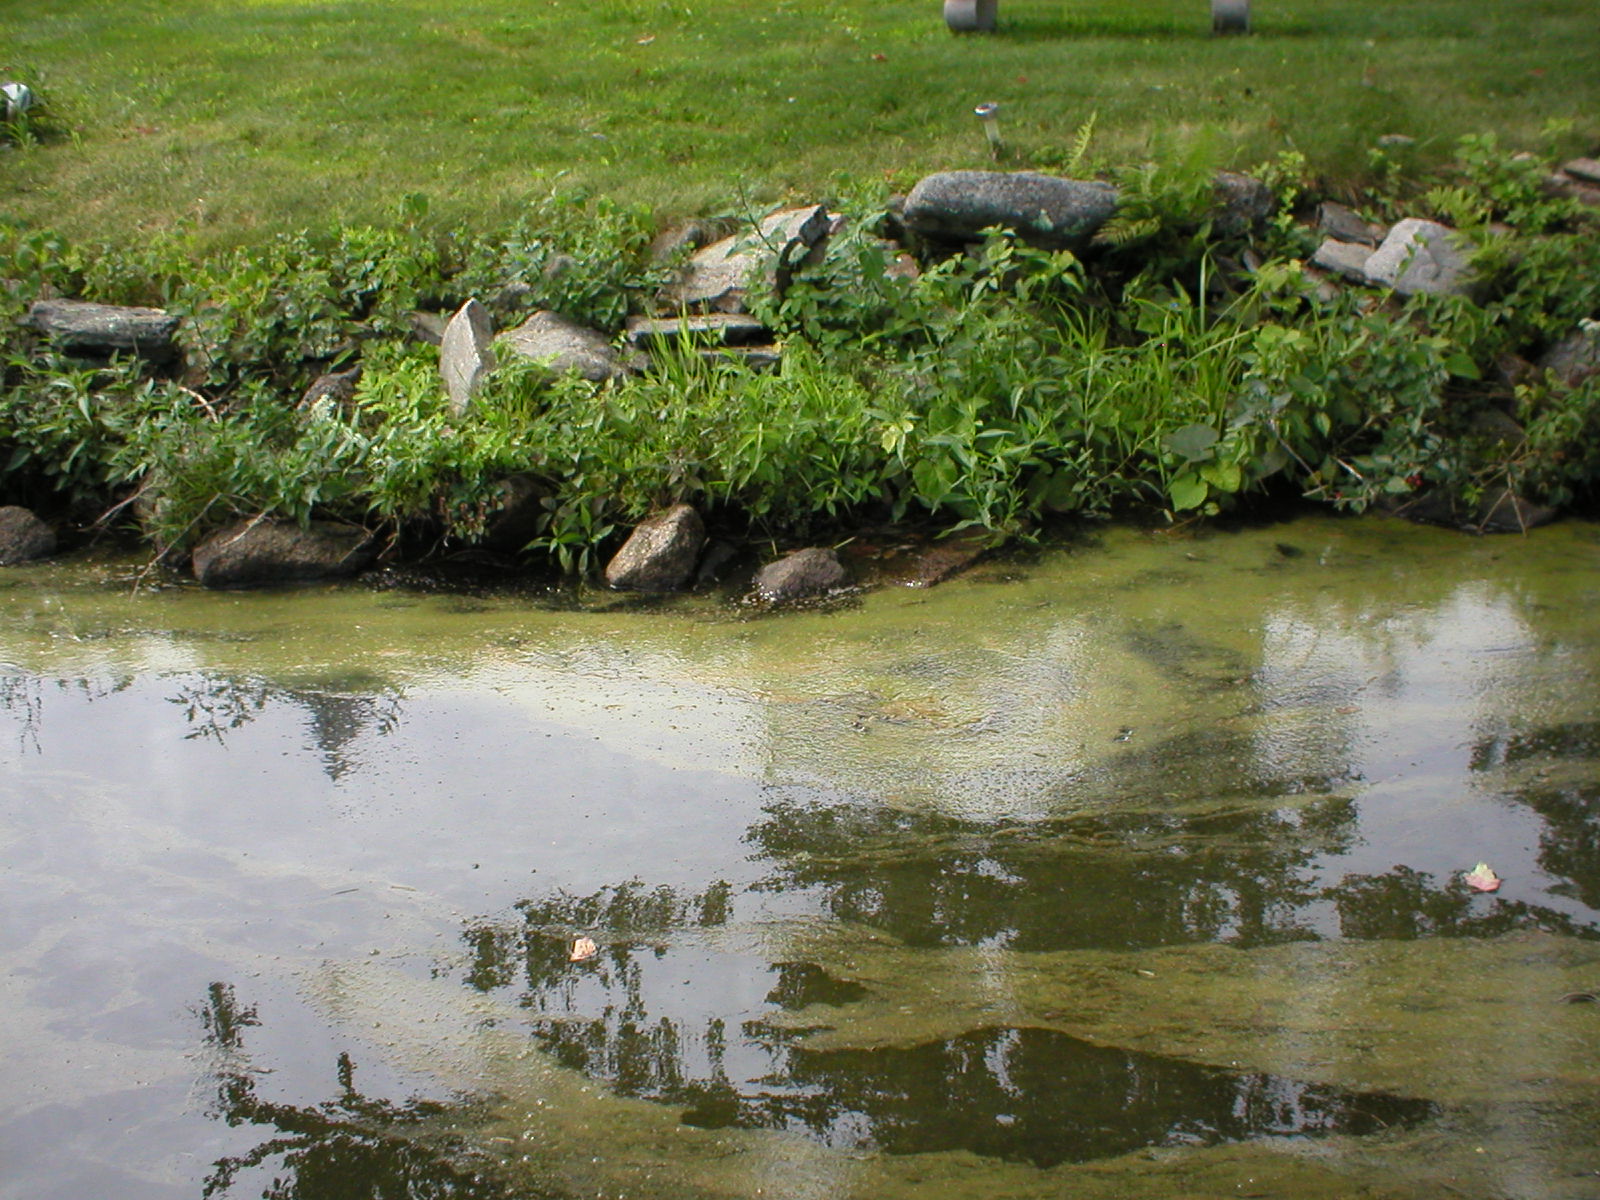
Documentation Context: Integrates certified laboratory water quality test results pre- and post-chemical treatment with date-stamped photographic records and video documentation. Field logs track immediate acute littoral impacts—including video of extensive lily pad chemical burning documented within 48 hours—followed by accelerated plant decay, organic shoreline accumulation, and subsequent cyanobacteria bloom progression (surface scums, drift lines, and suspended cell colonies).
Chatham Health Baseline
Pre-Treatment
Pre-Treatment Water Conditions — July 9, 2026
Official CT DPH State Public Health Laboratory test report confirming nutrient-limited, limnologically stable baseline conditions (0.014 mg/L total phosphorus, non-detect nitrogen, 1.2 NTU turbidity) prior to plant die-off.
Field Testing & Lab Results — August 5 & August 7, 2026
Three independent water test reports documenting active bloom conditions, cell density, and nutrient shifts following herbicide-induced macrophyte decomposition, alongside detailed explanatory analysis.
Video DocumentationVIDEOS TAKEN JULY 24, 2026, 48HRS AFTER FLUMIOXAZIN CHEMICAL TREATMENT
video1
video2
video3
video4
Field Photographic Log
August 4
5 Photos
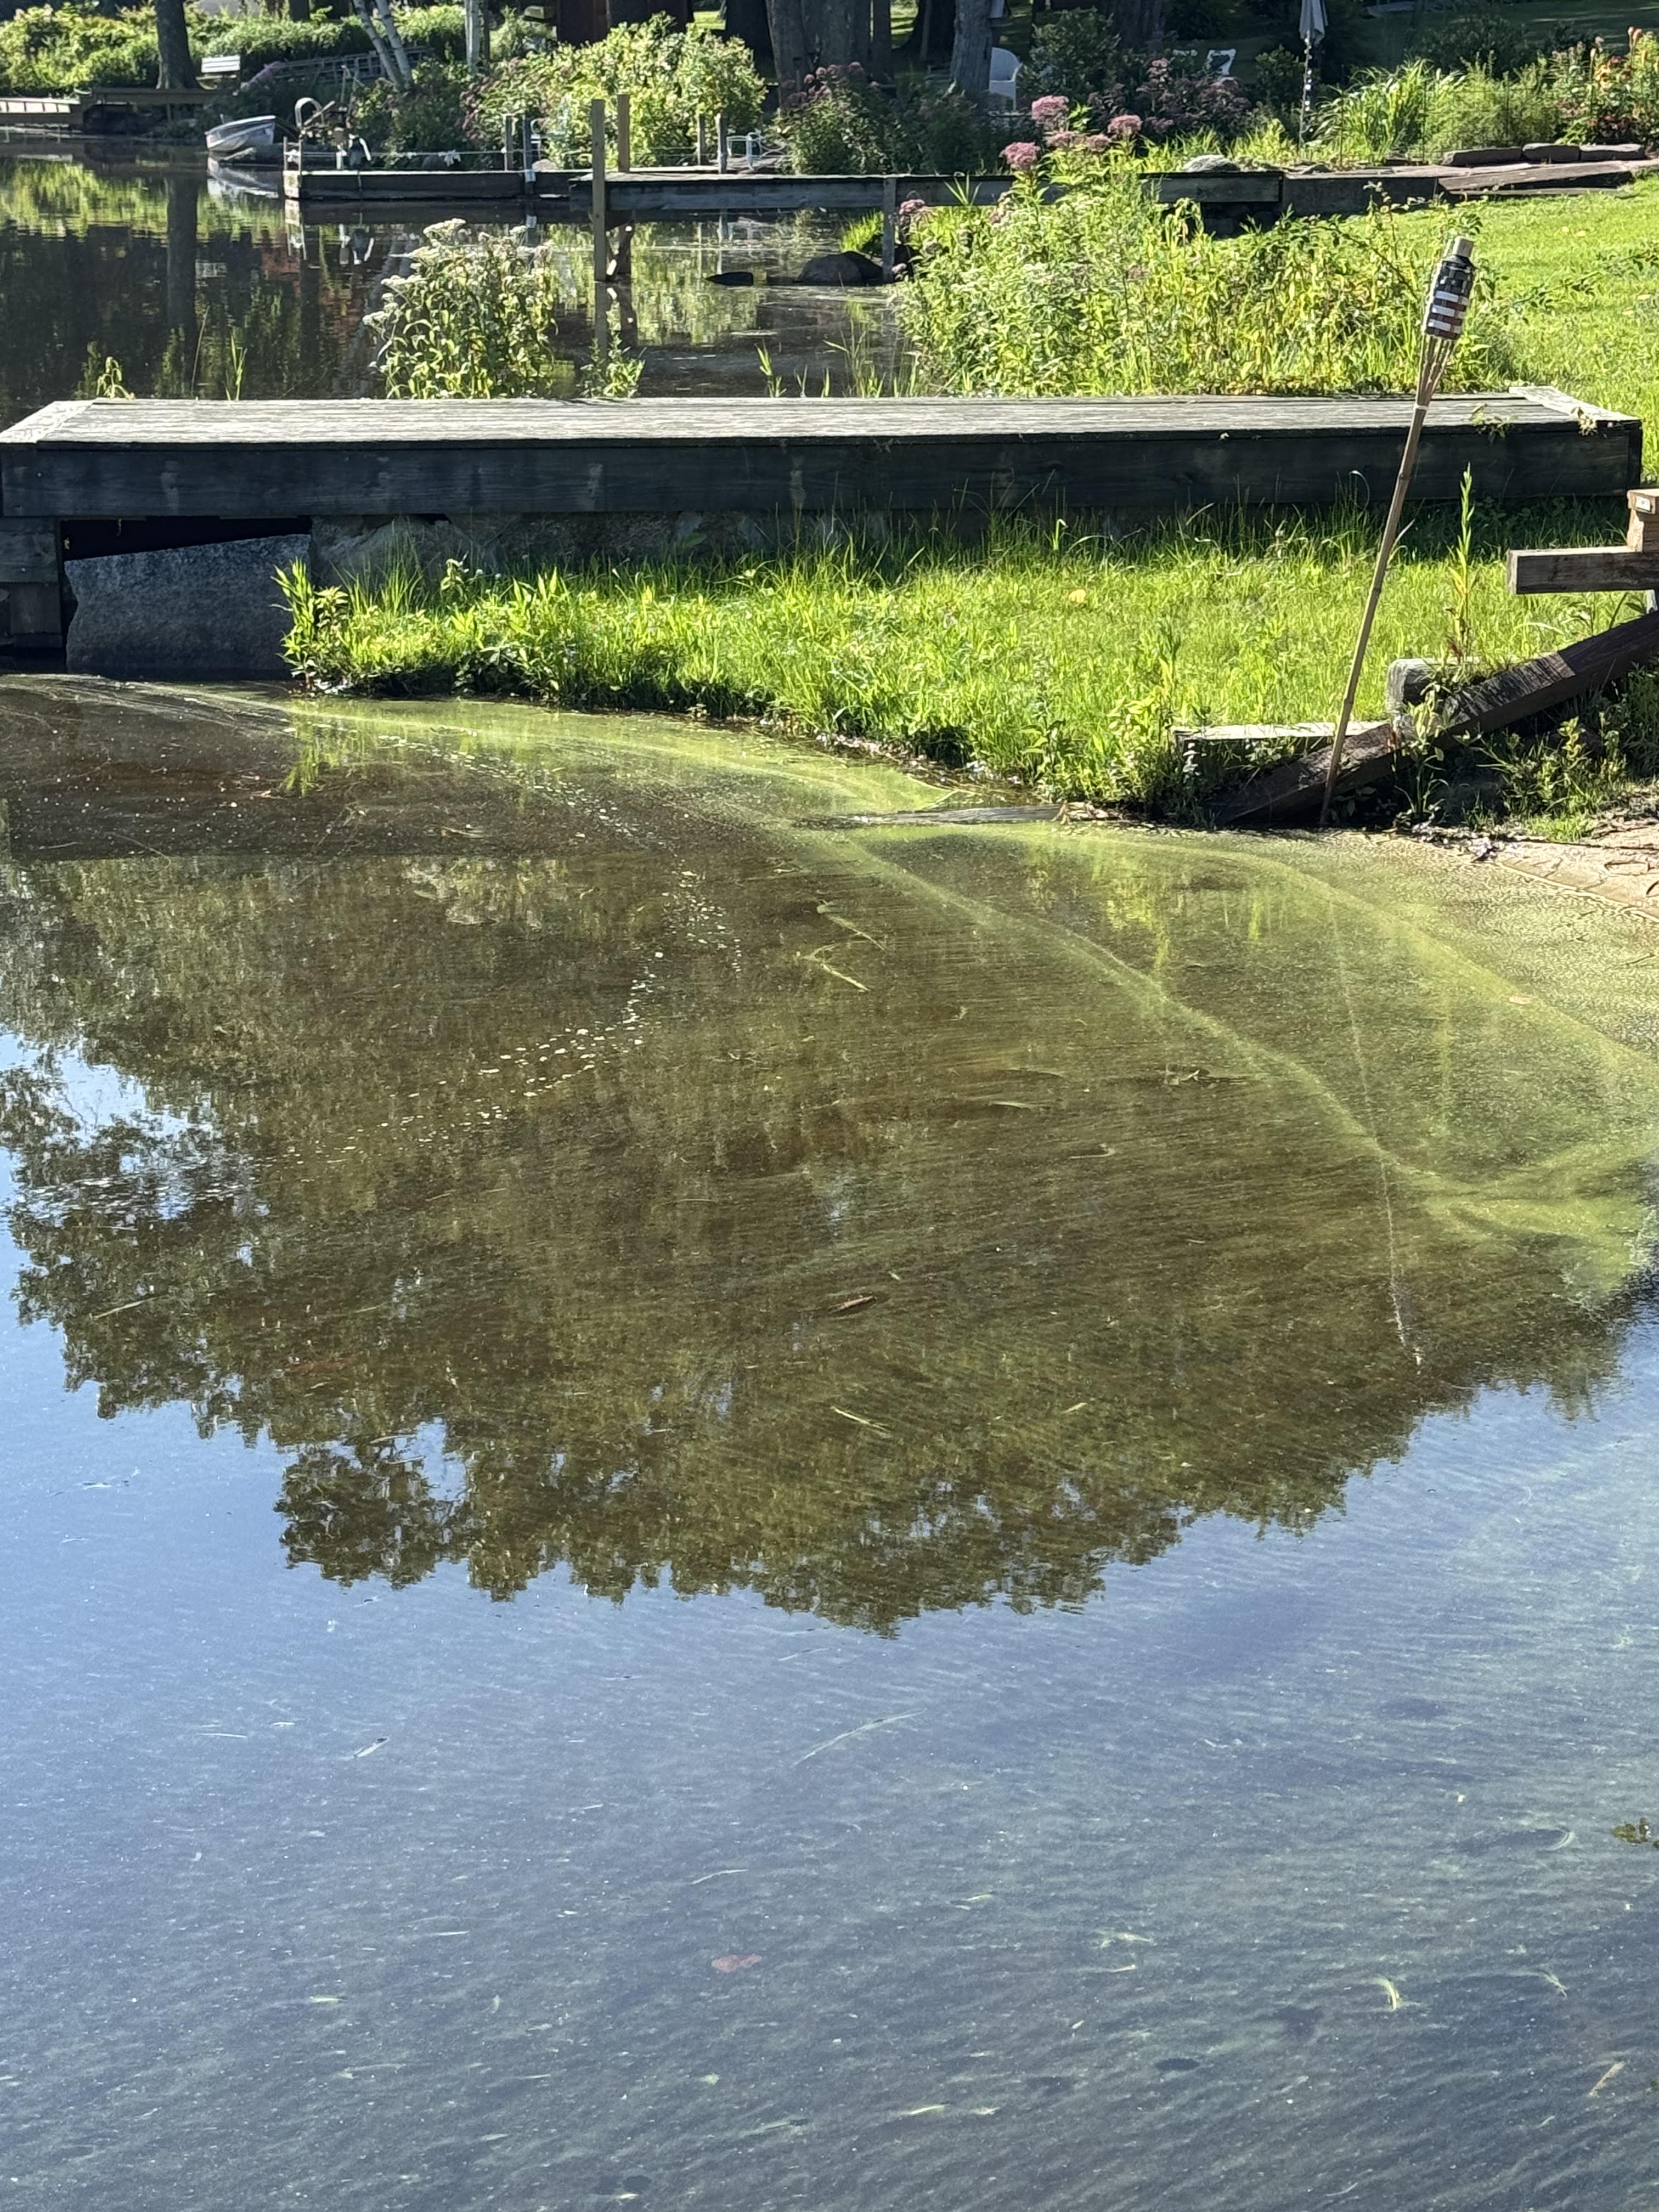
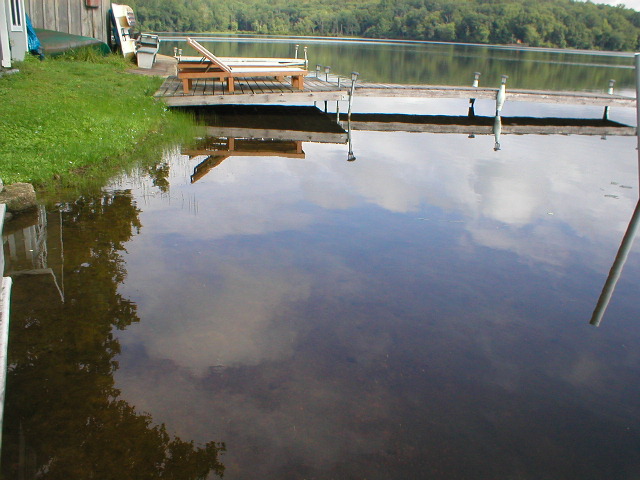
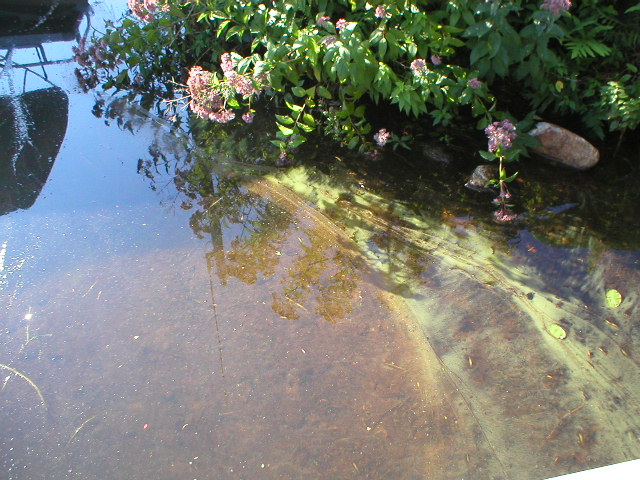
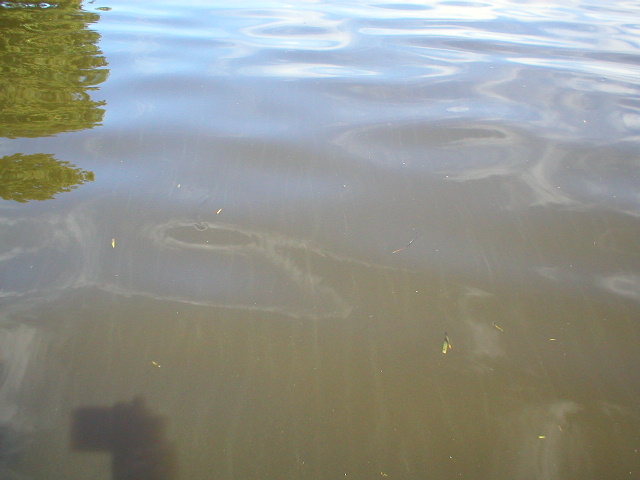
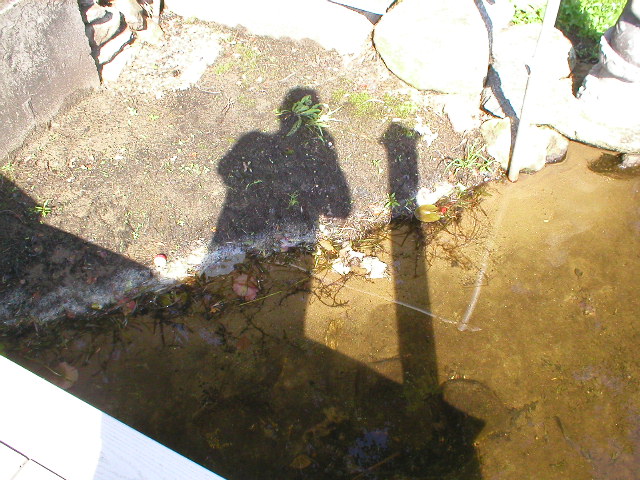
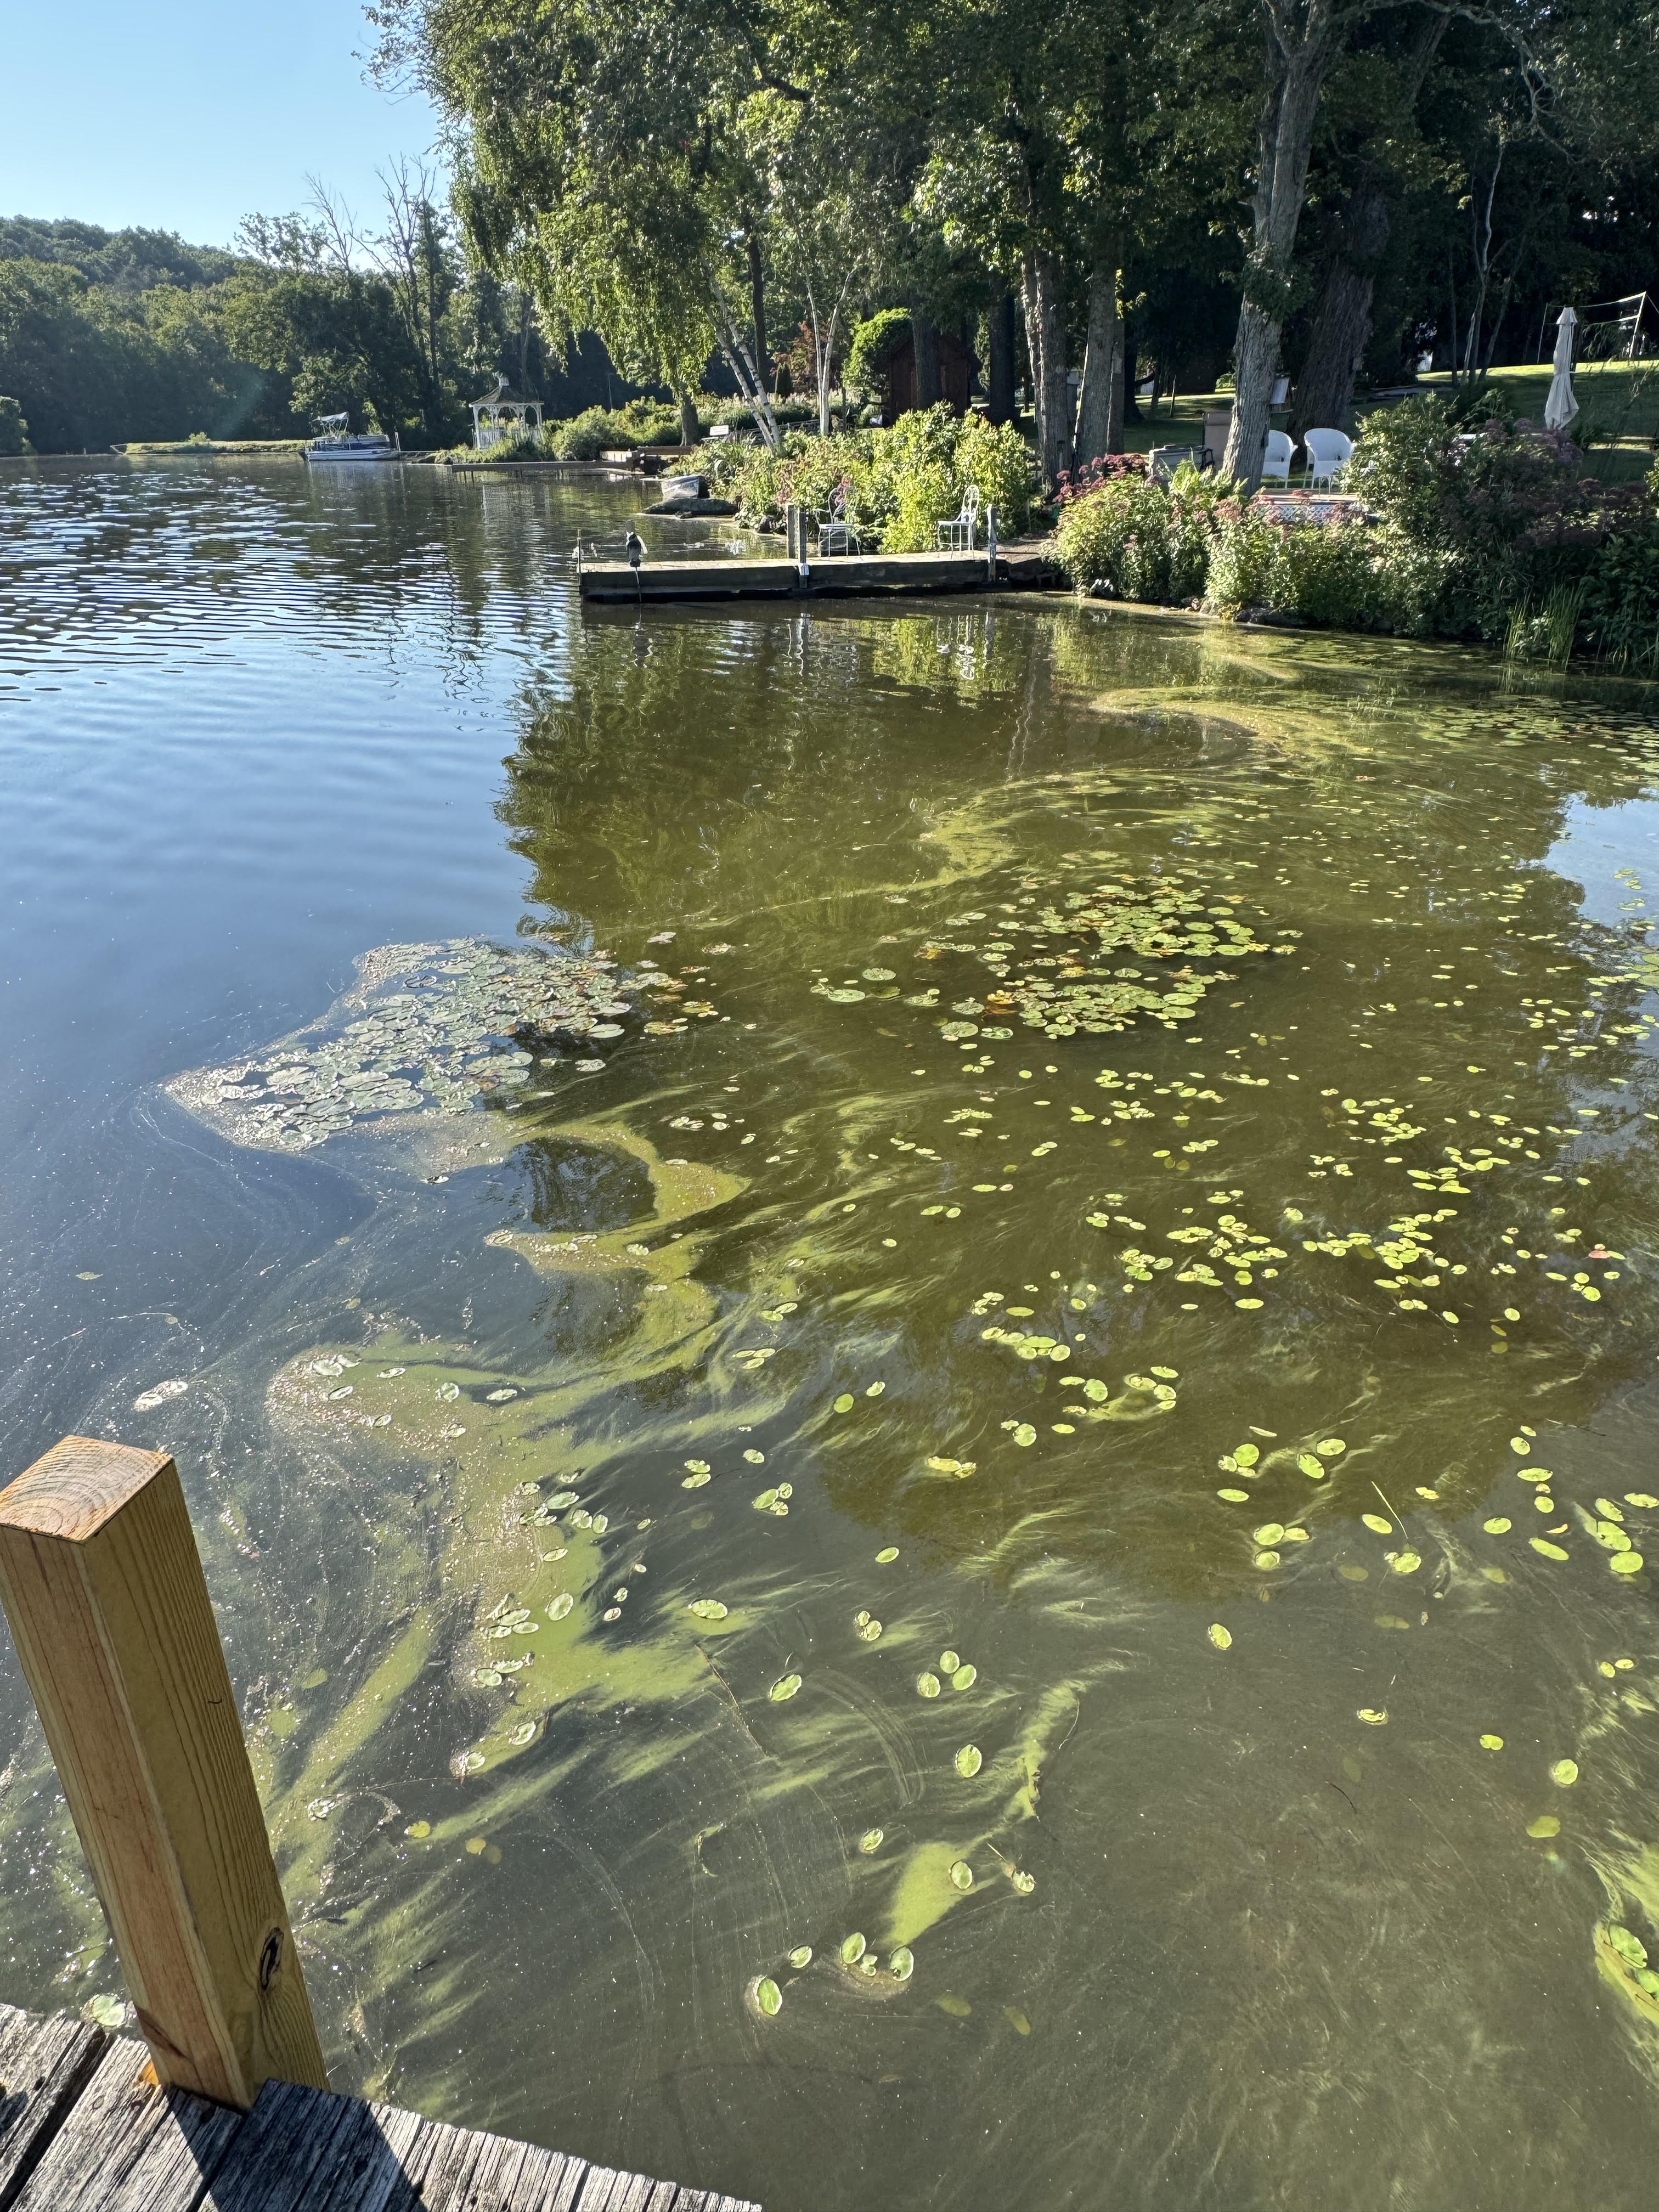
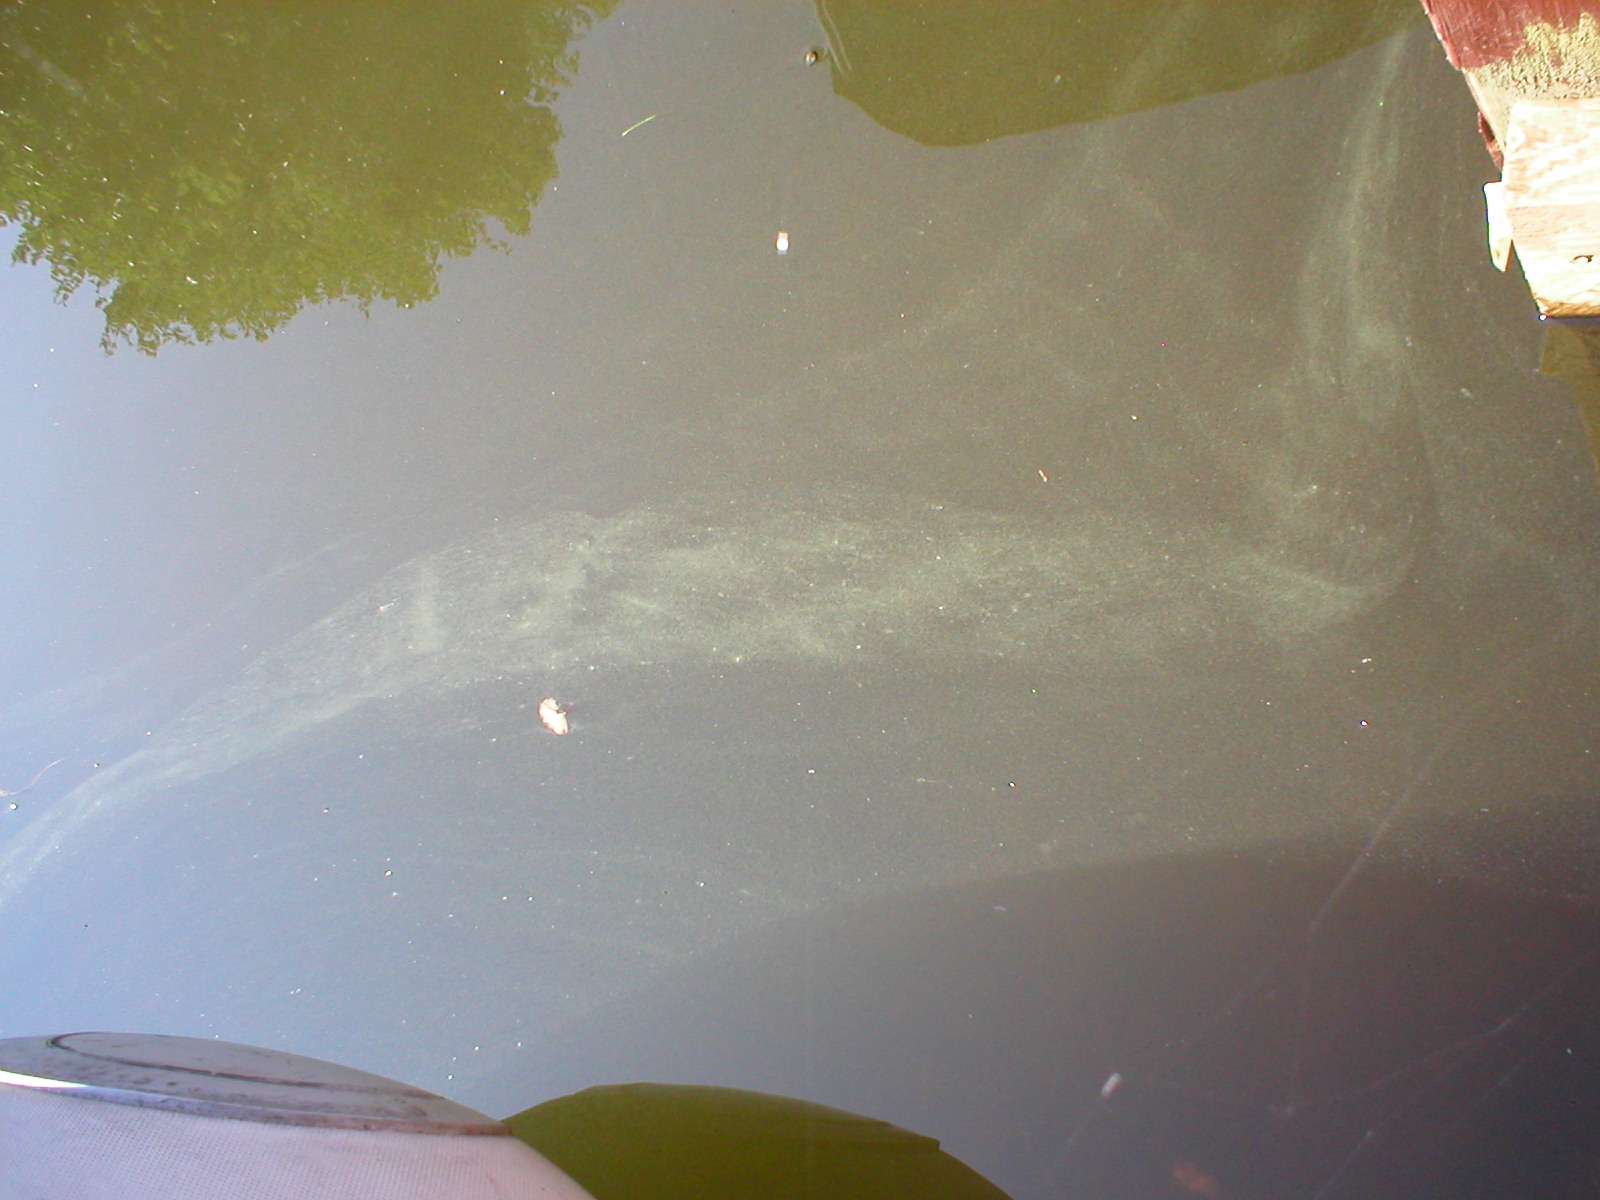
Initial observations of early surface discoloration and localized particulate suspension. Windward coves showing light green surface film developing along vegetation fringes.
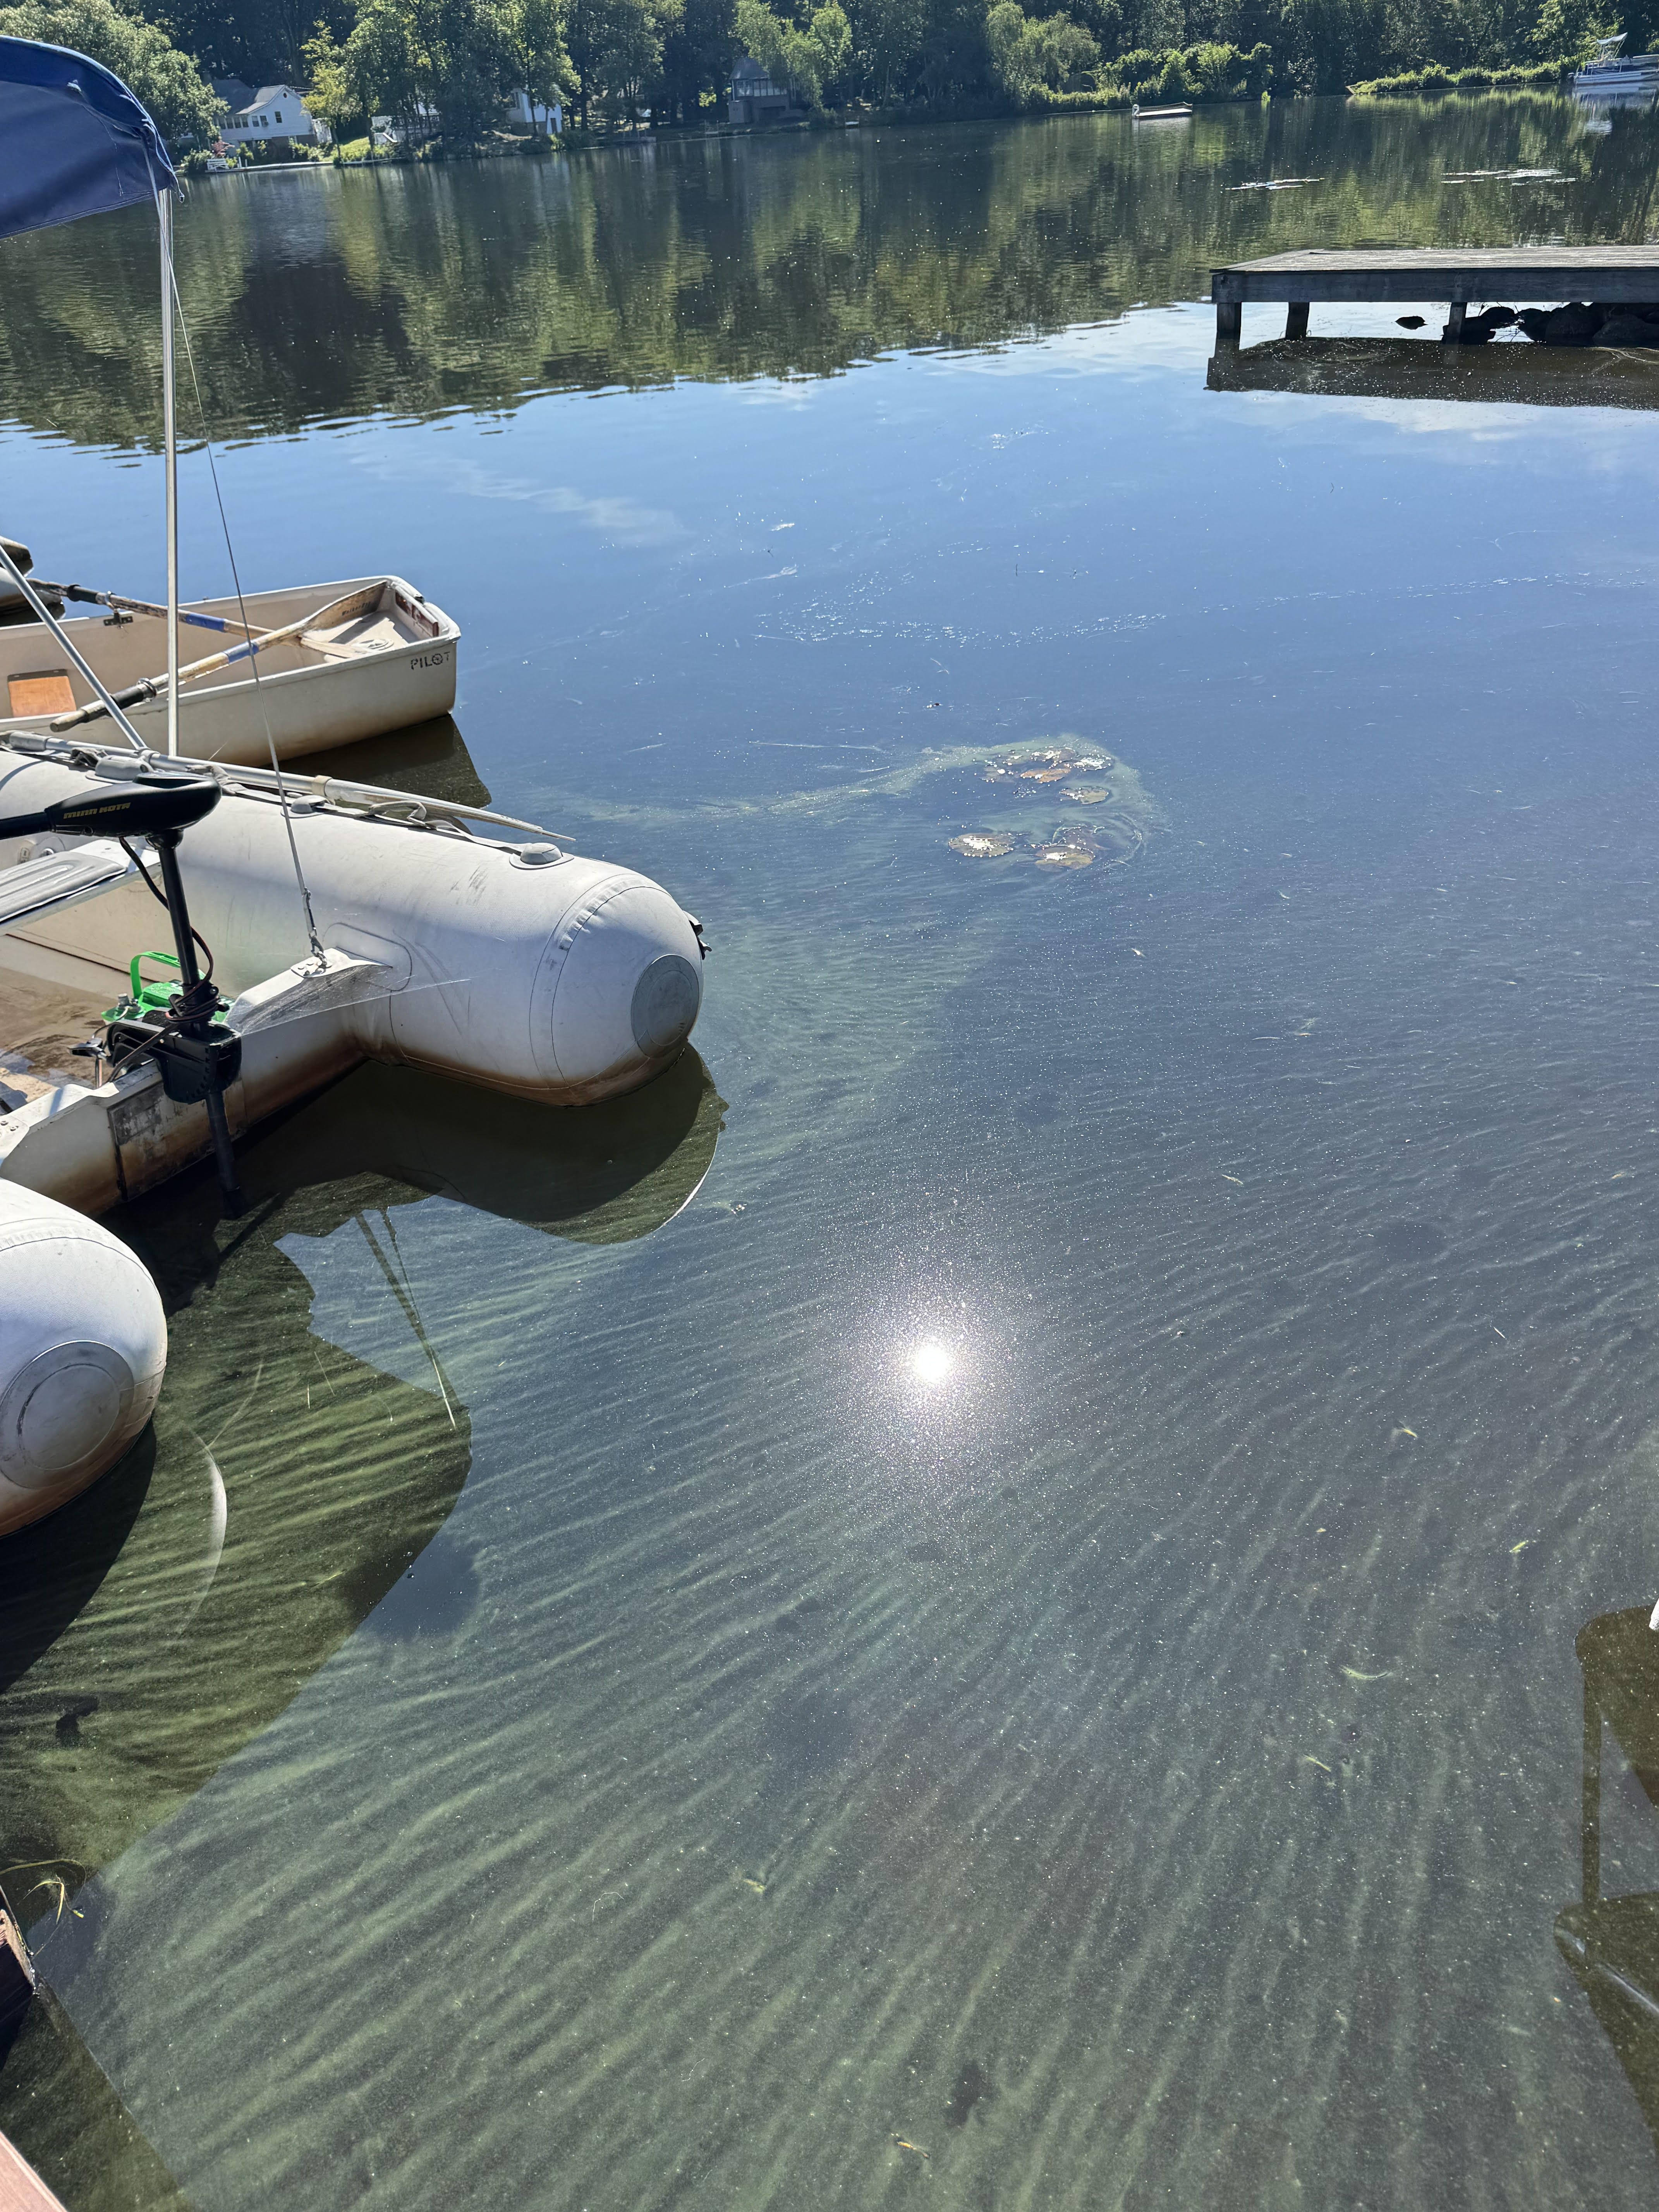
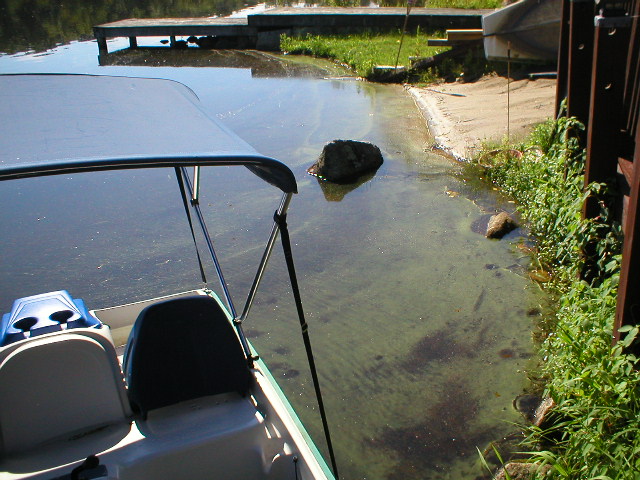
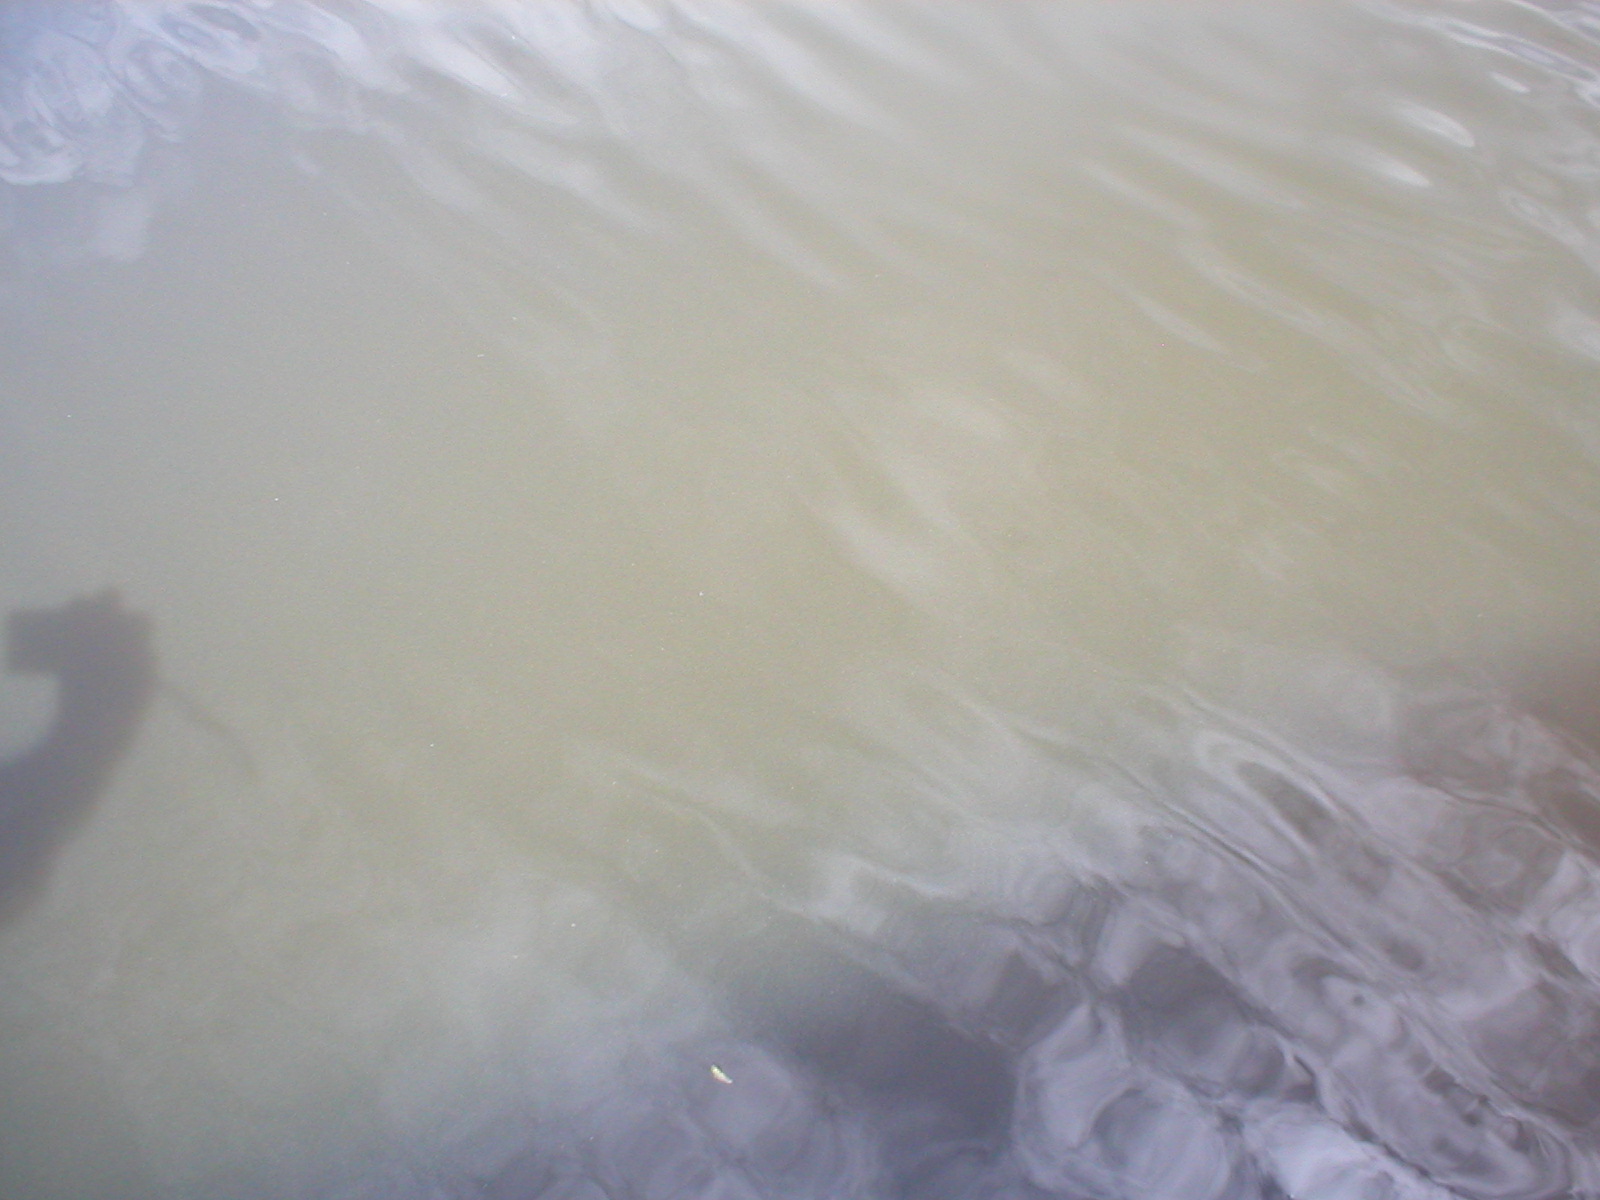
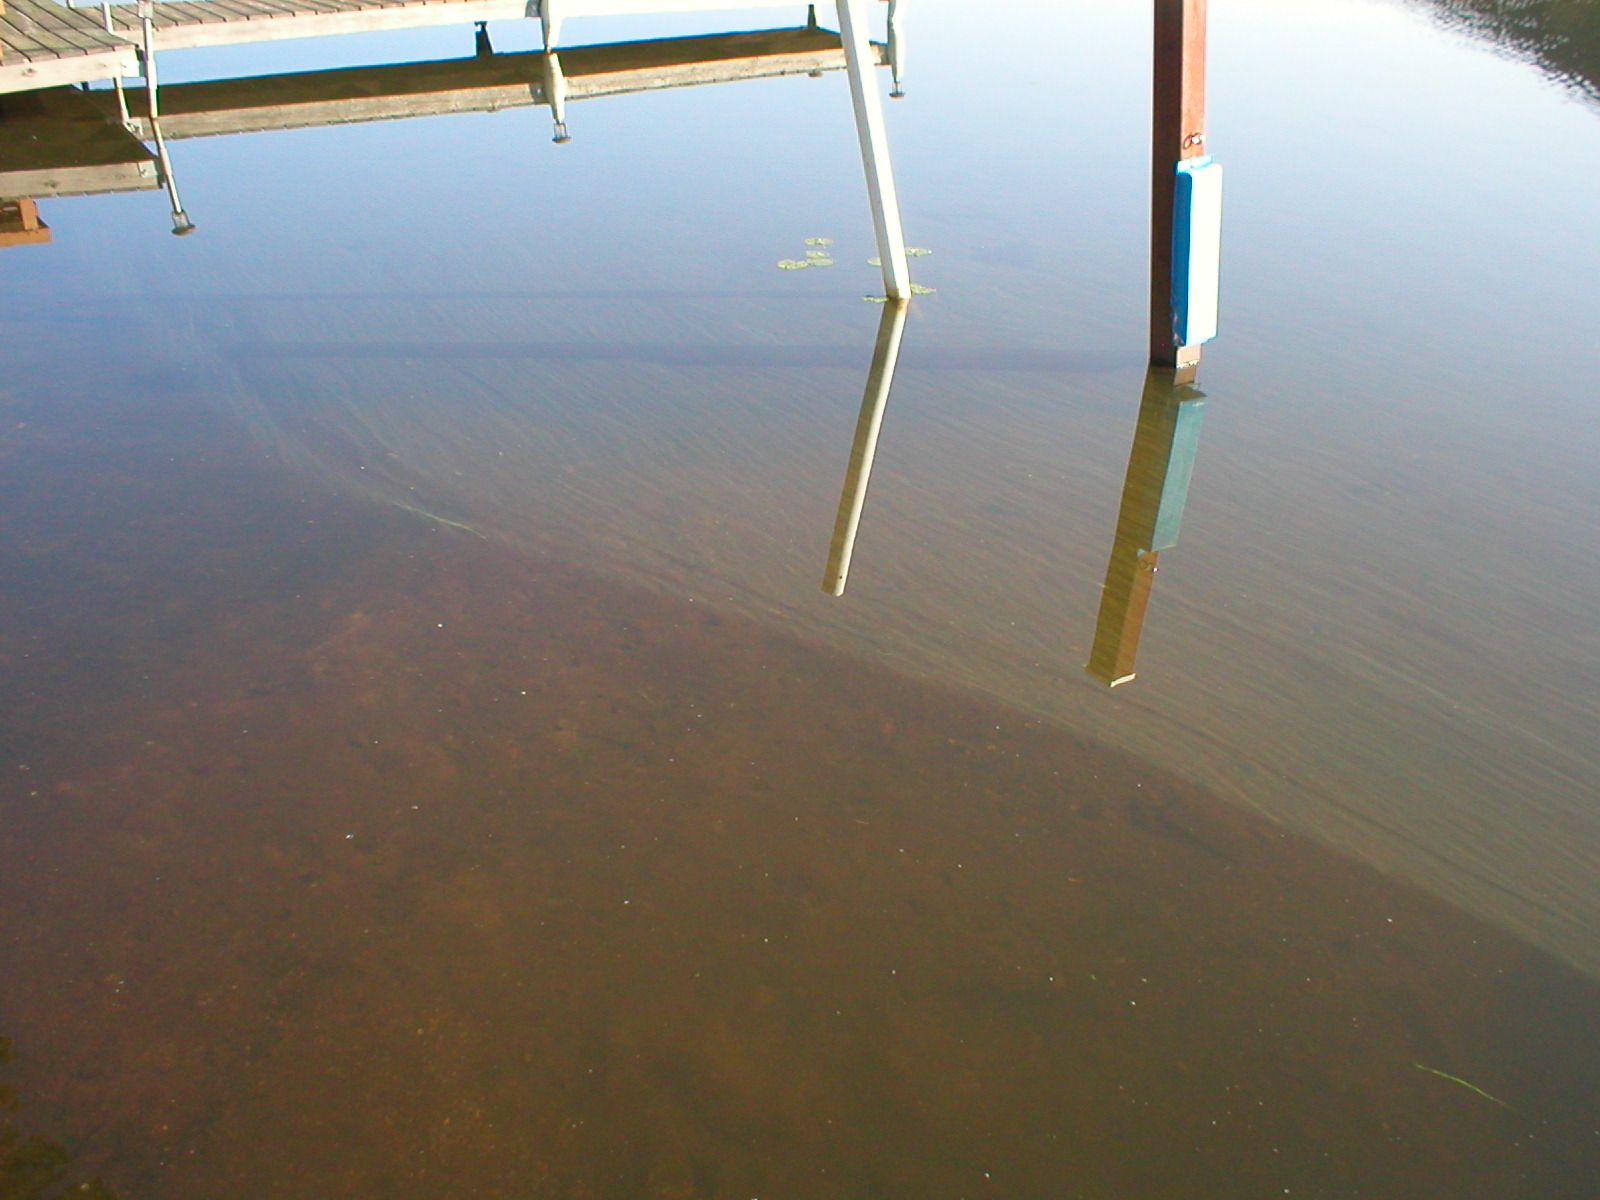
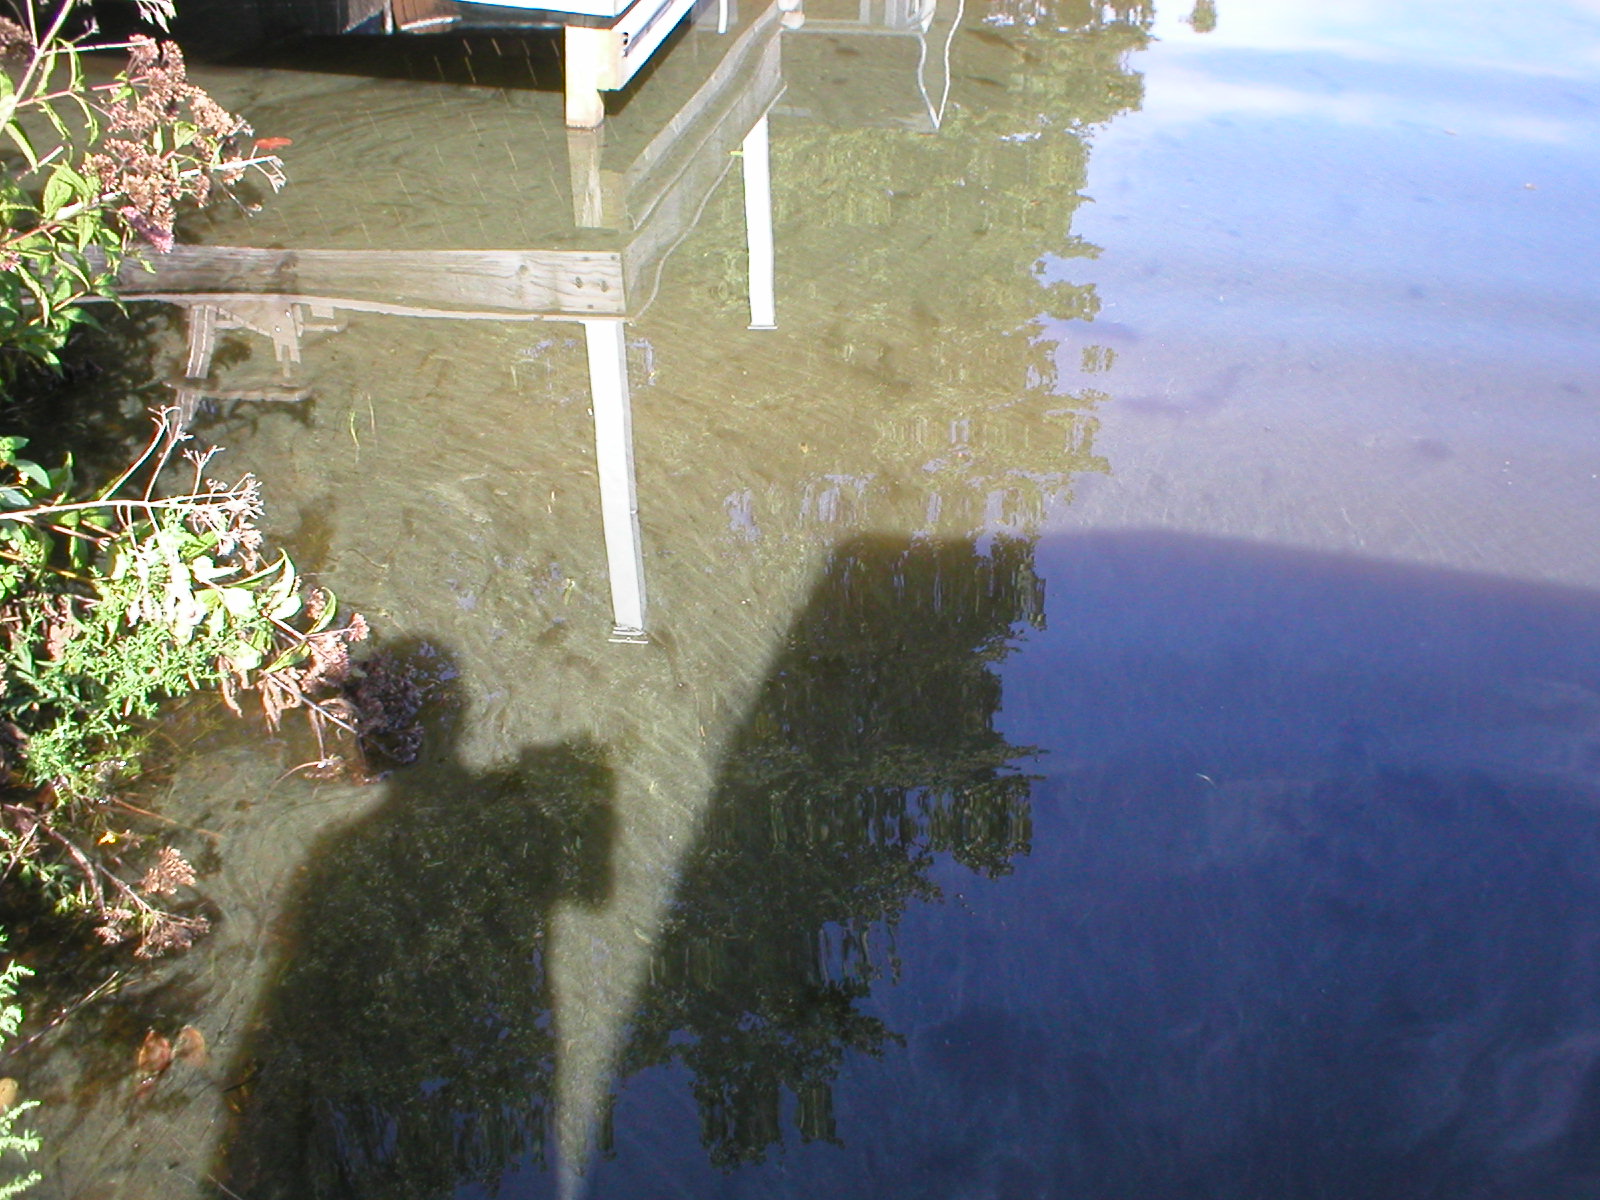
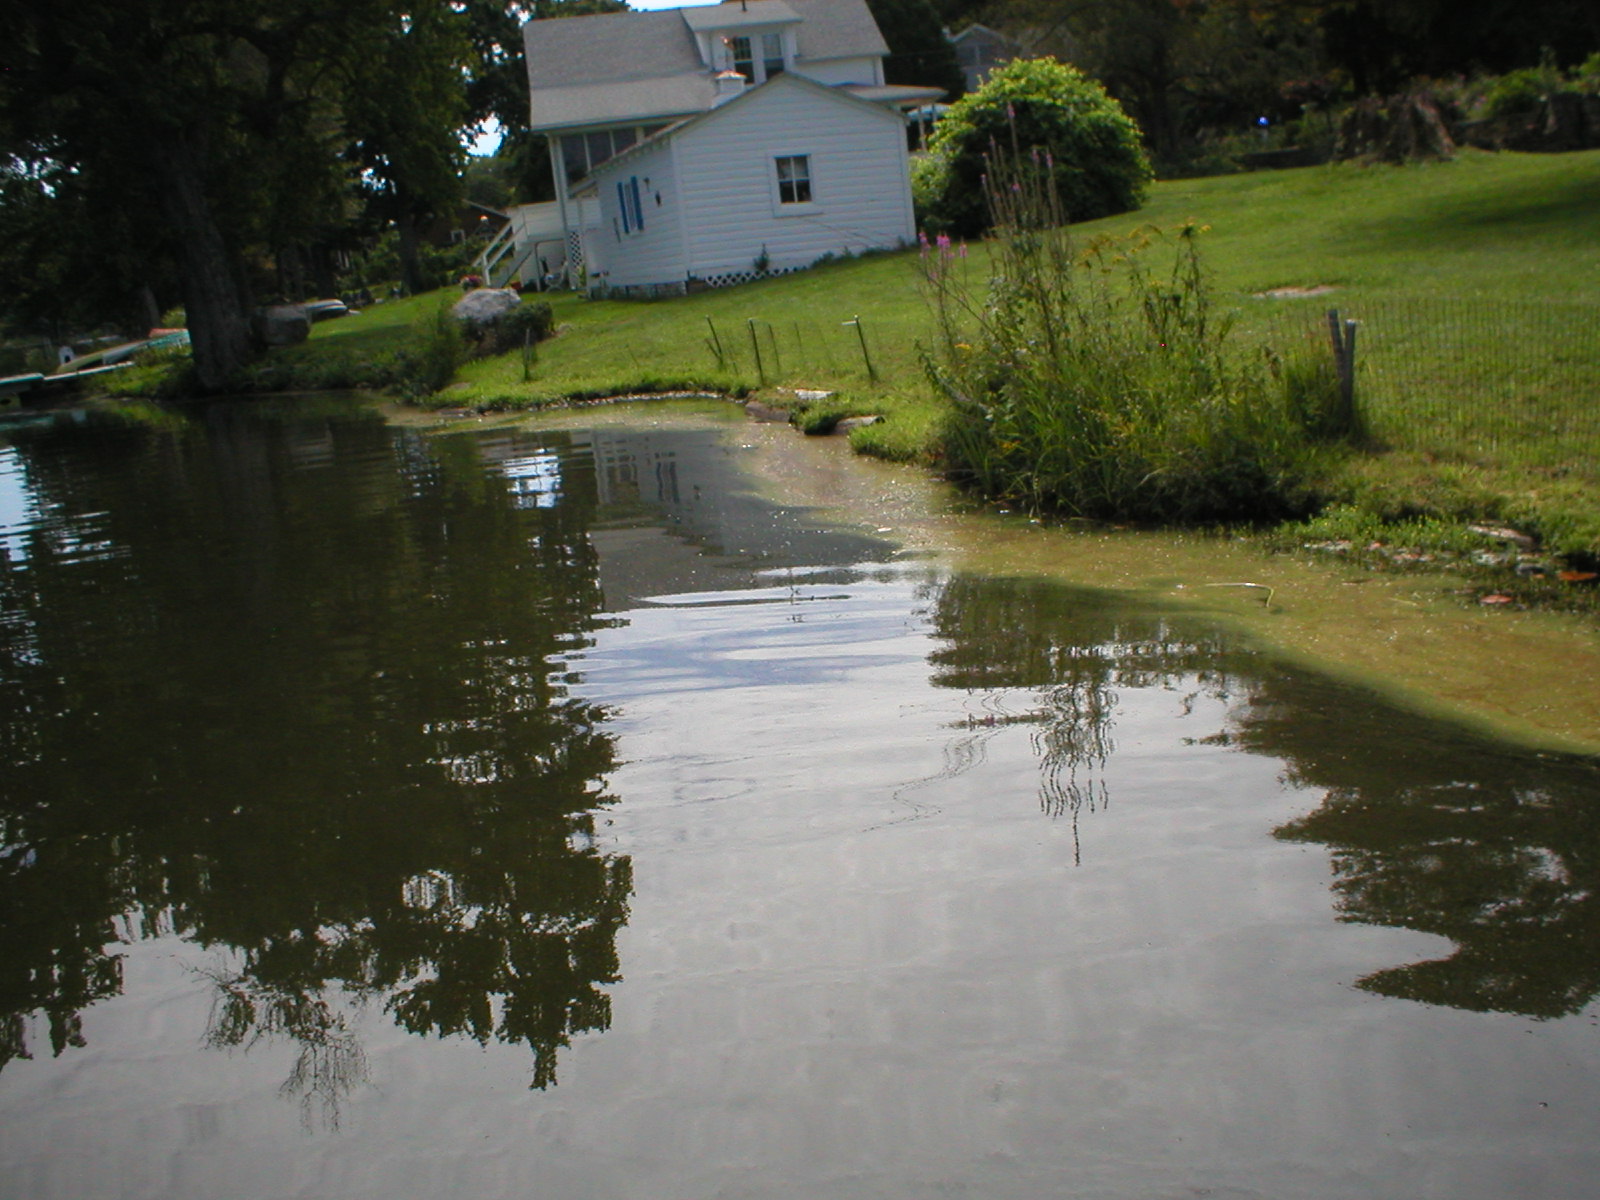
Wide shoreline overview showing water clarity and perimeter conditions.
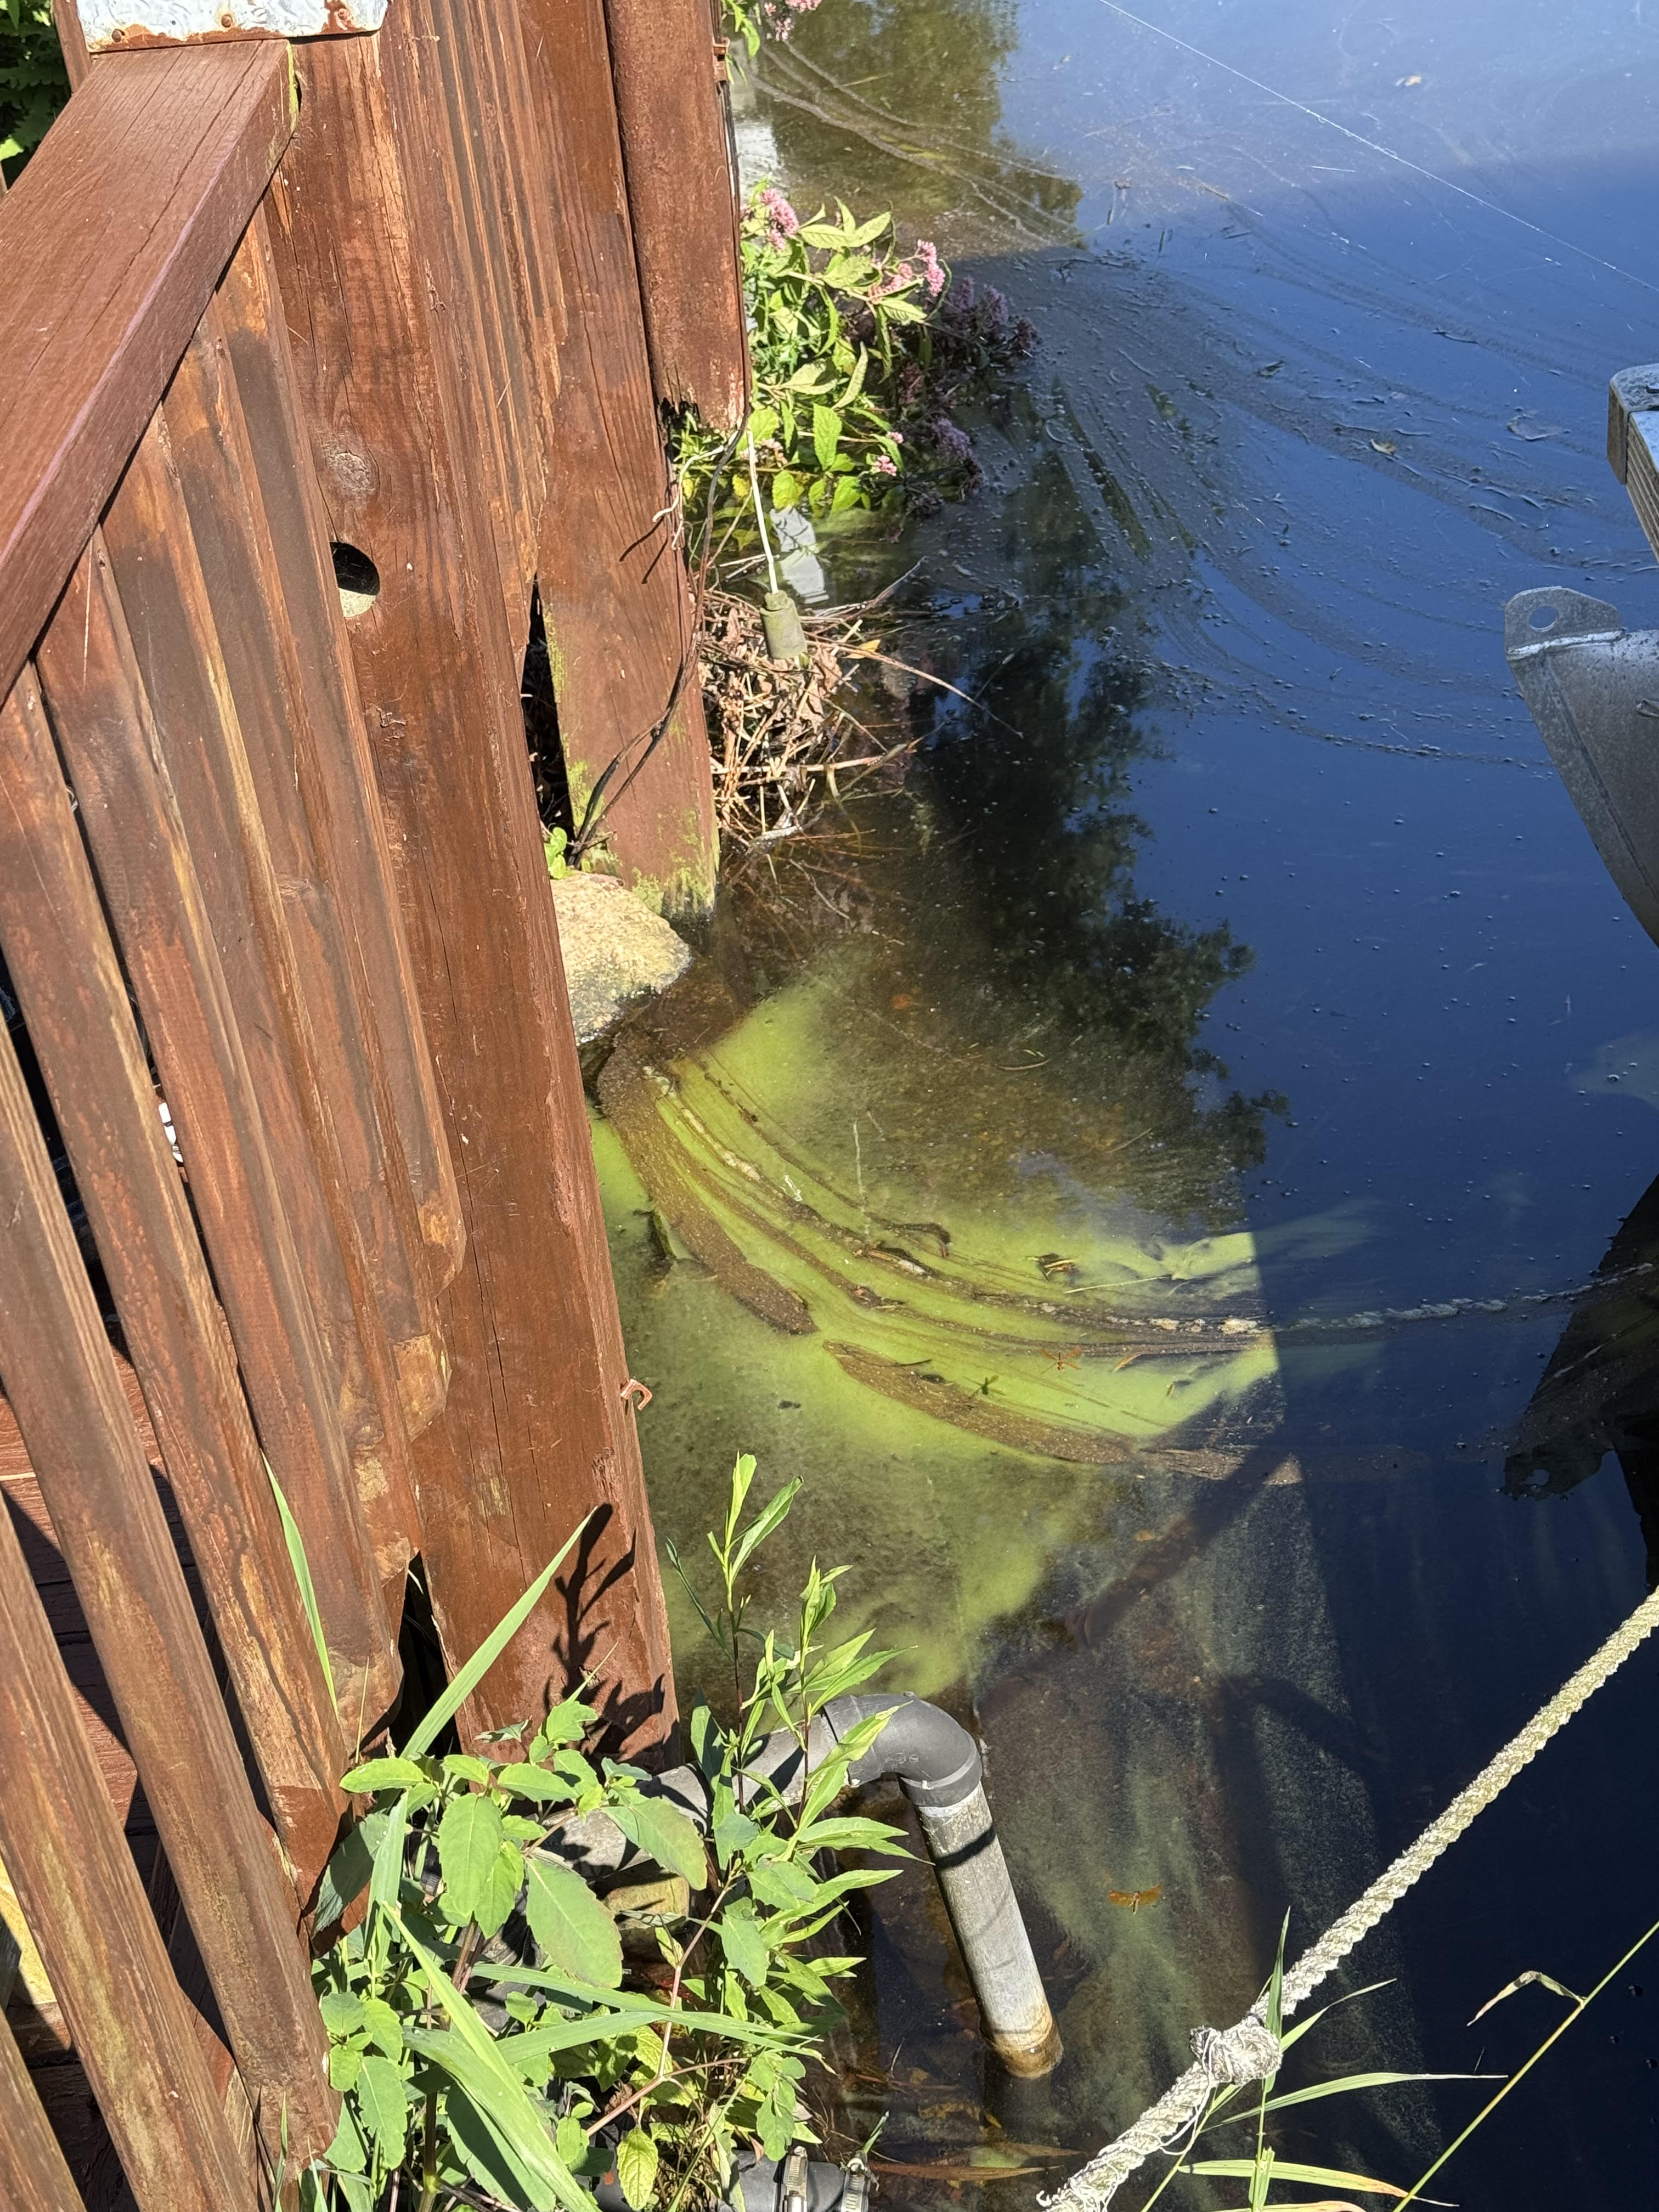
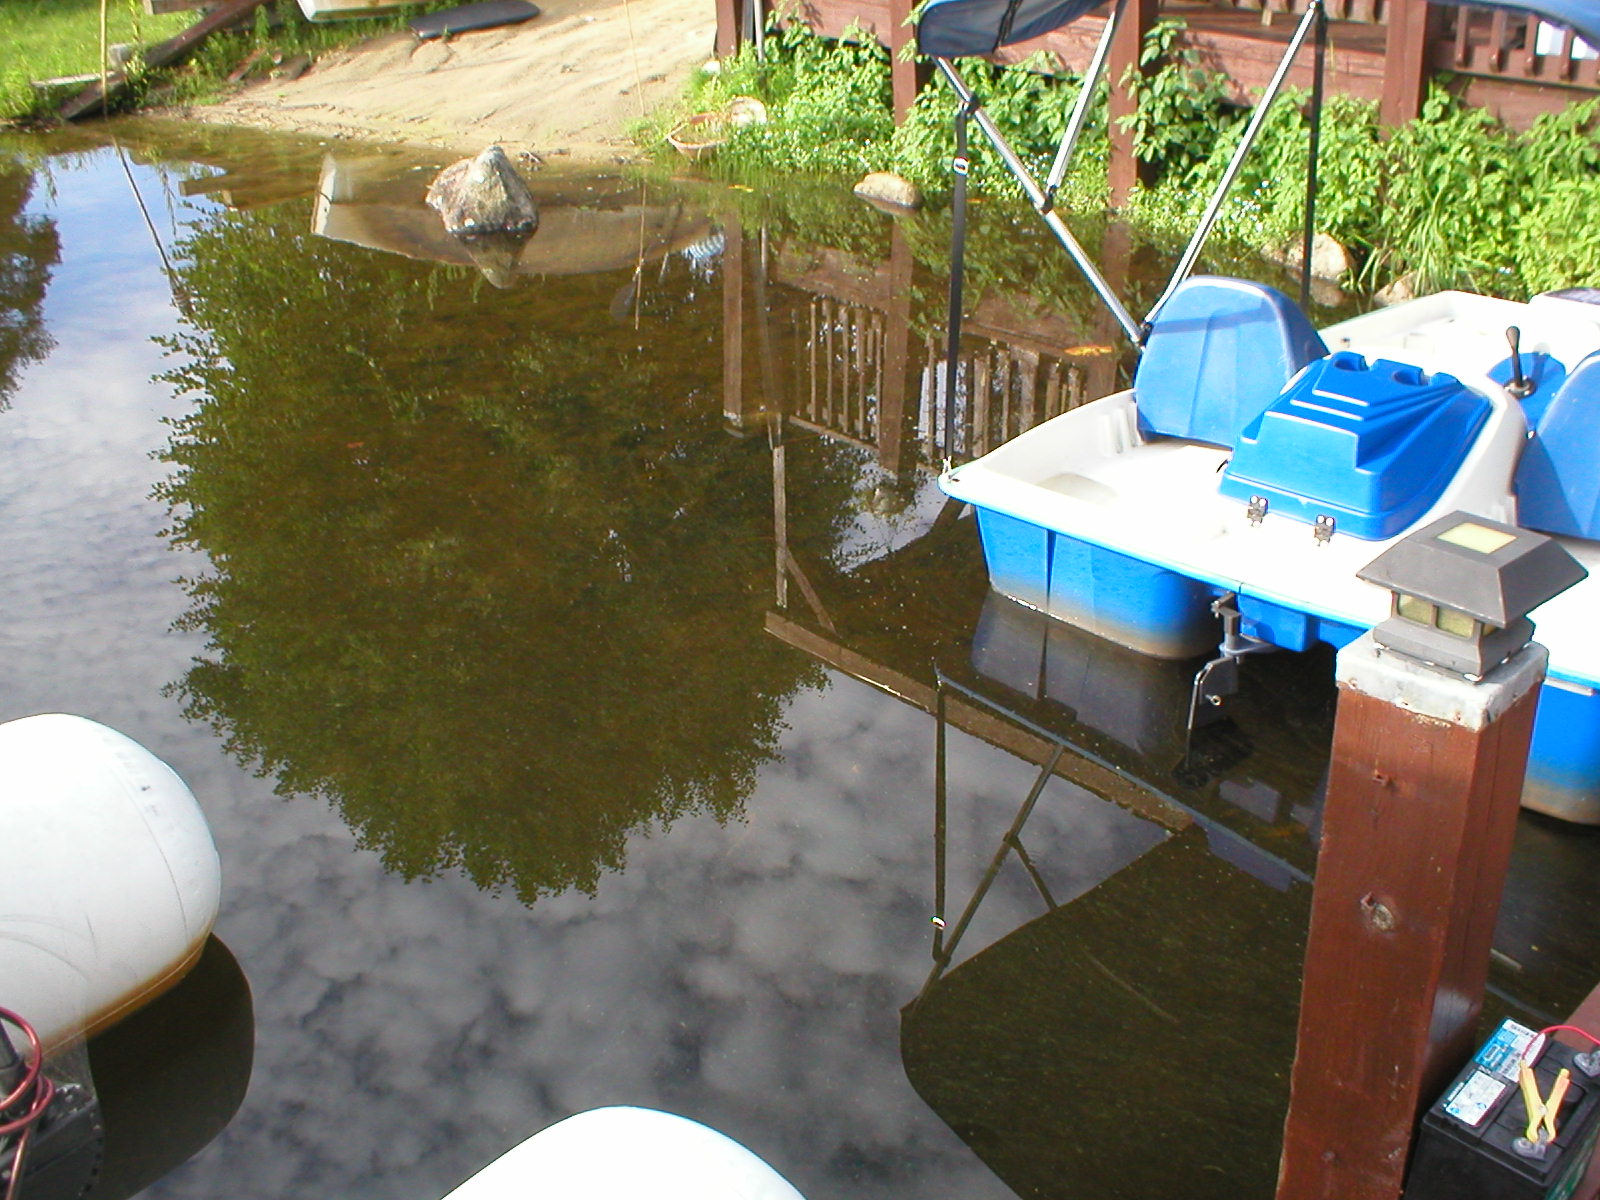
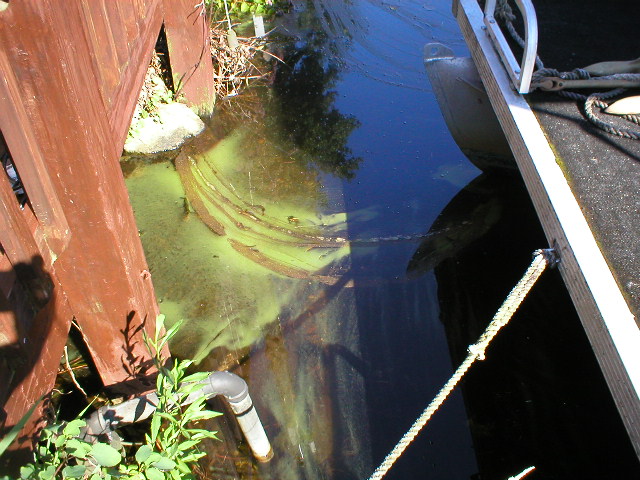
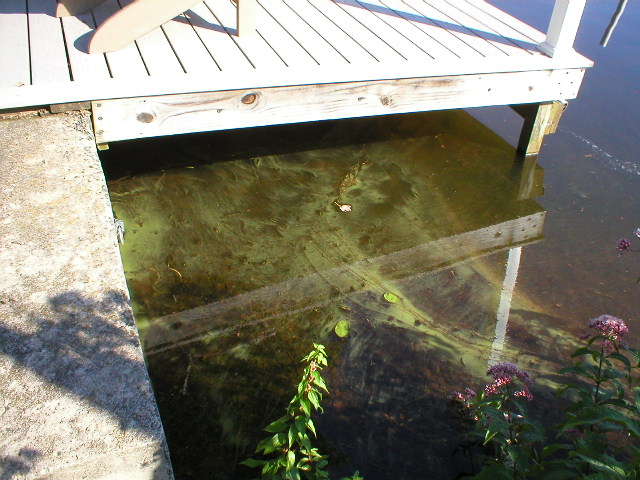
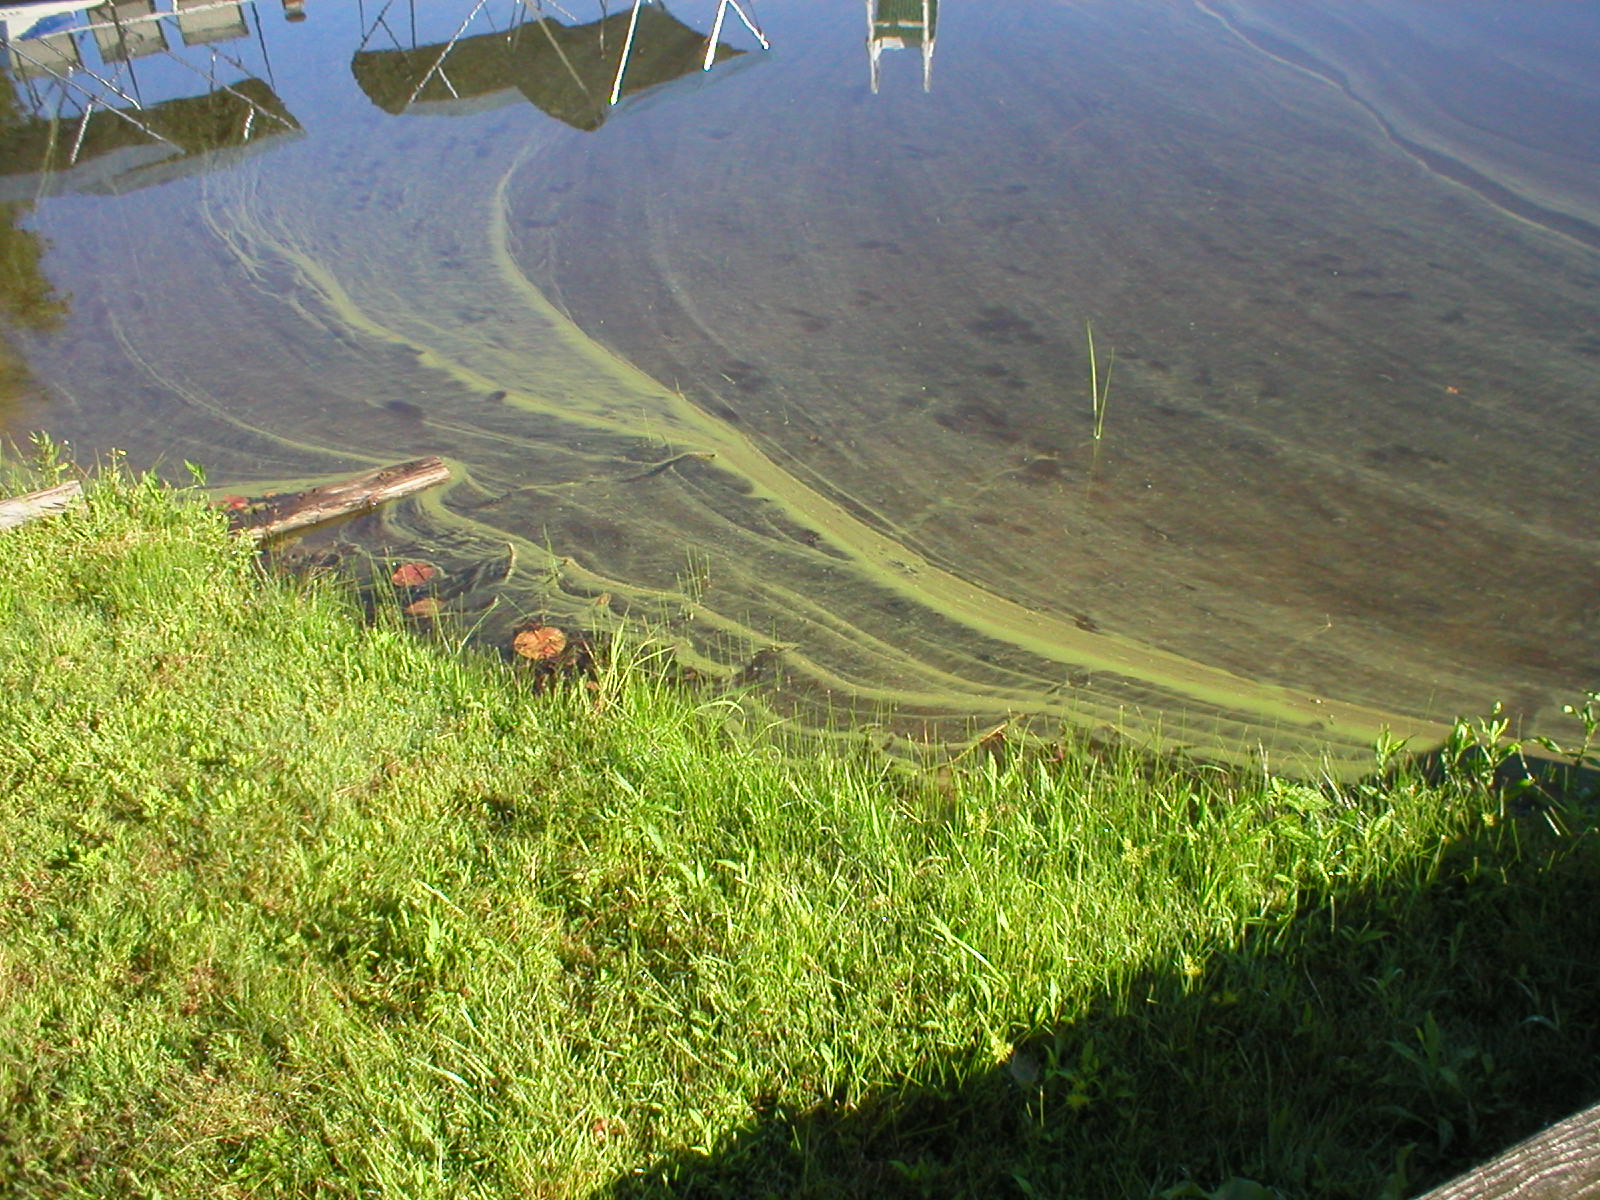
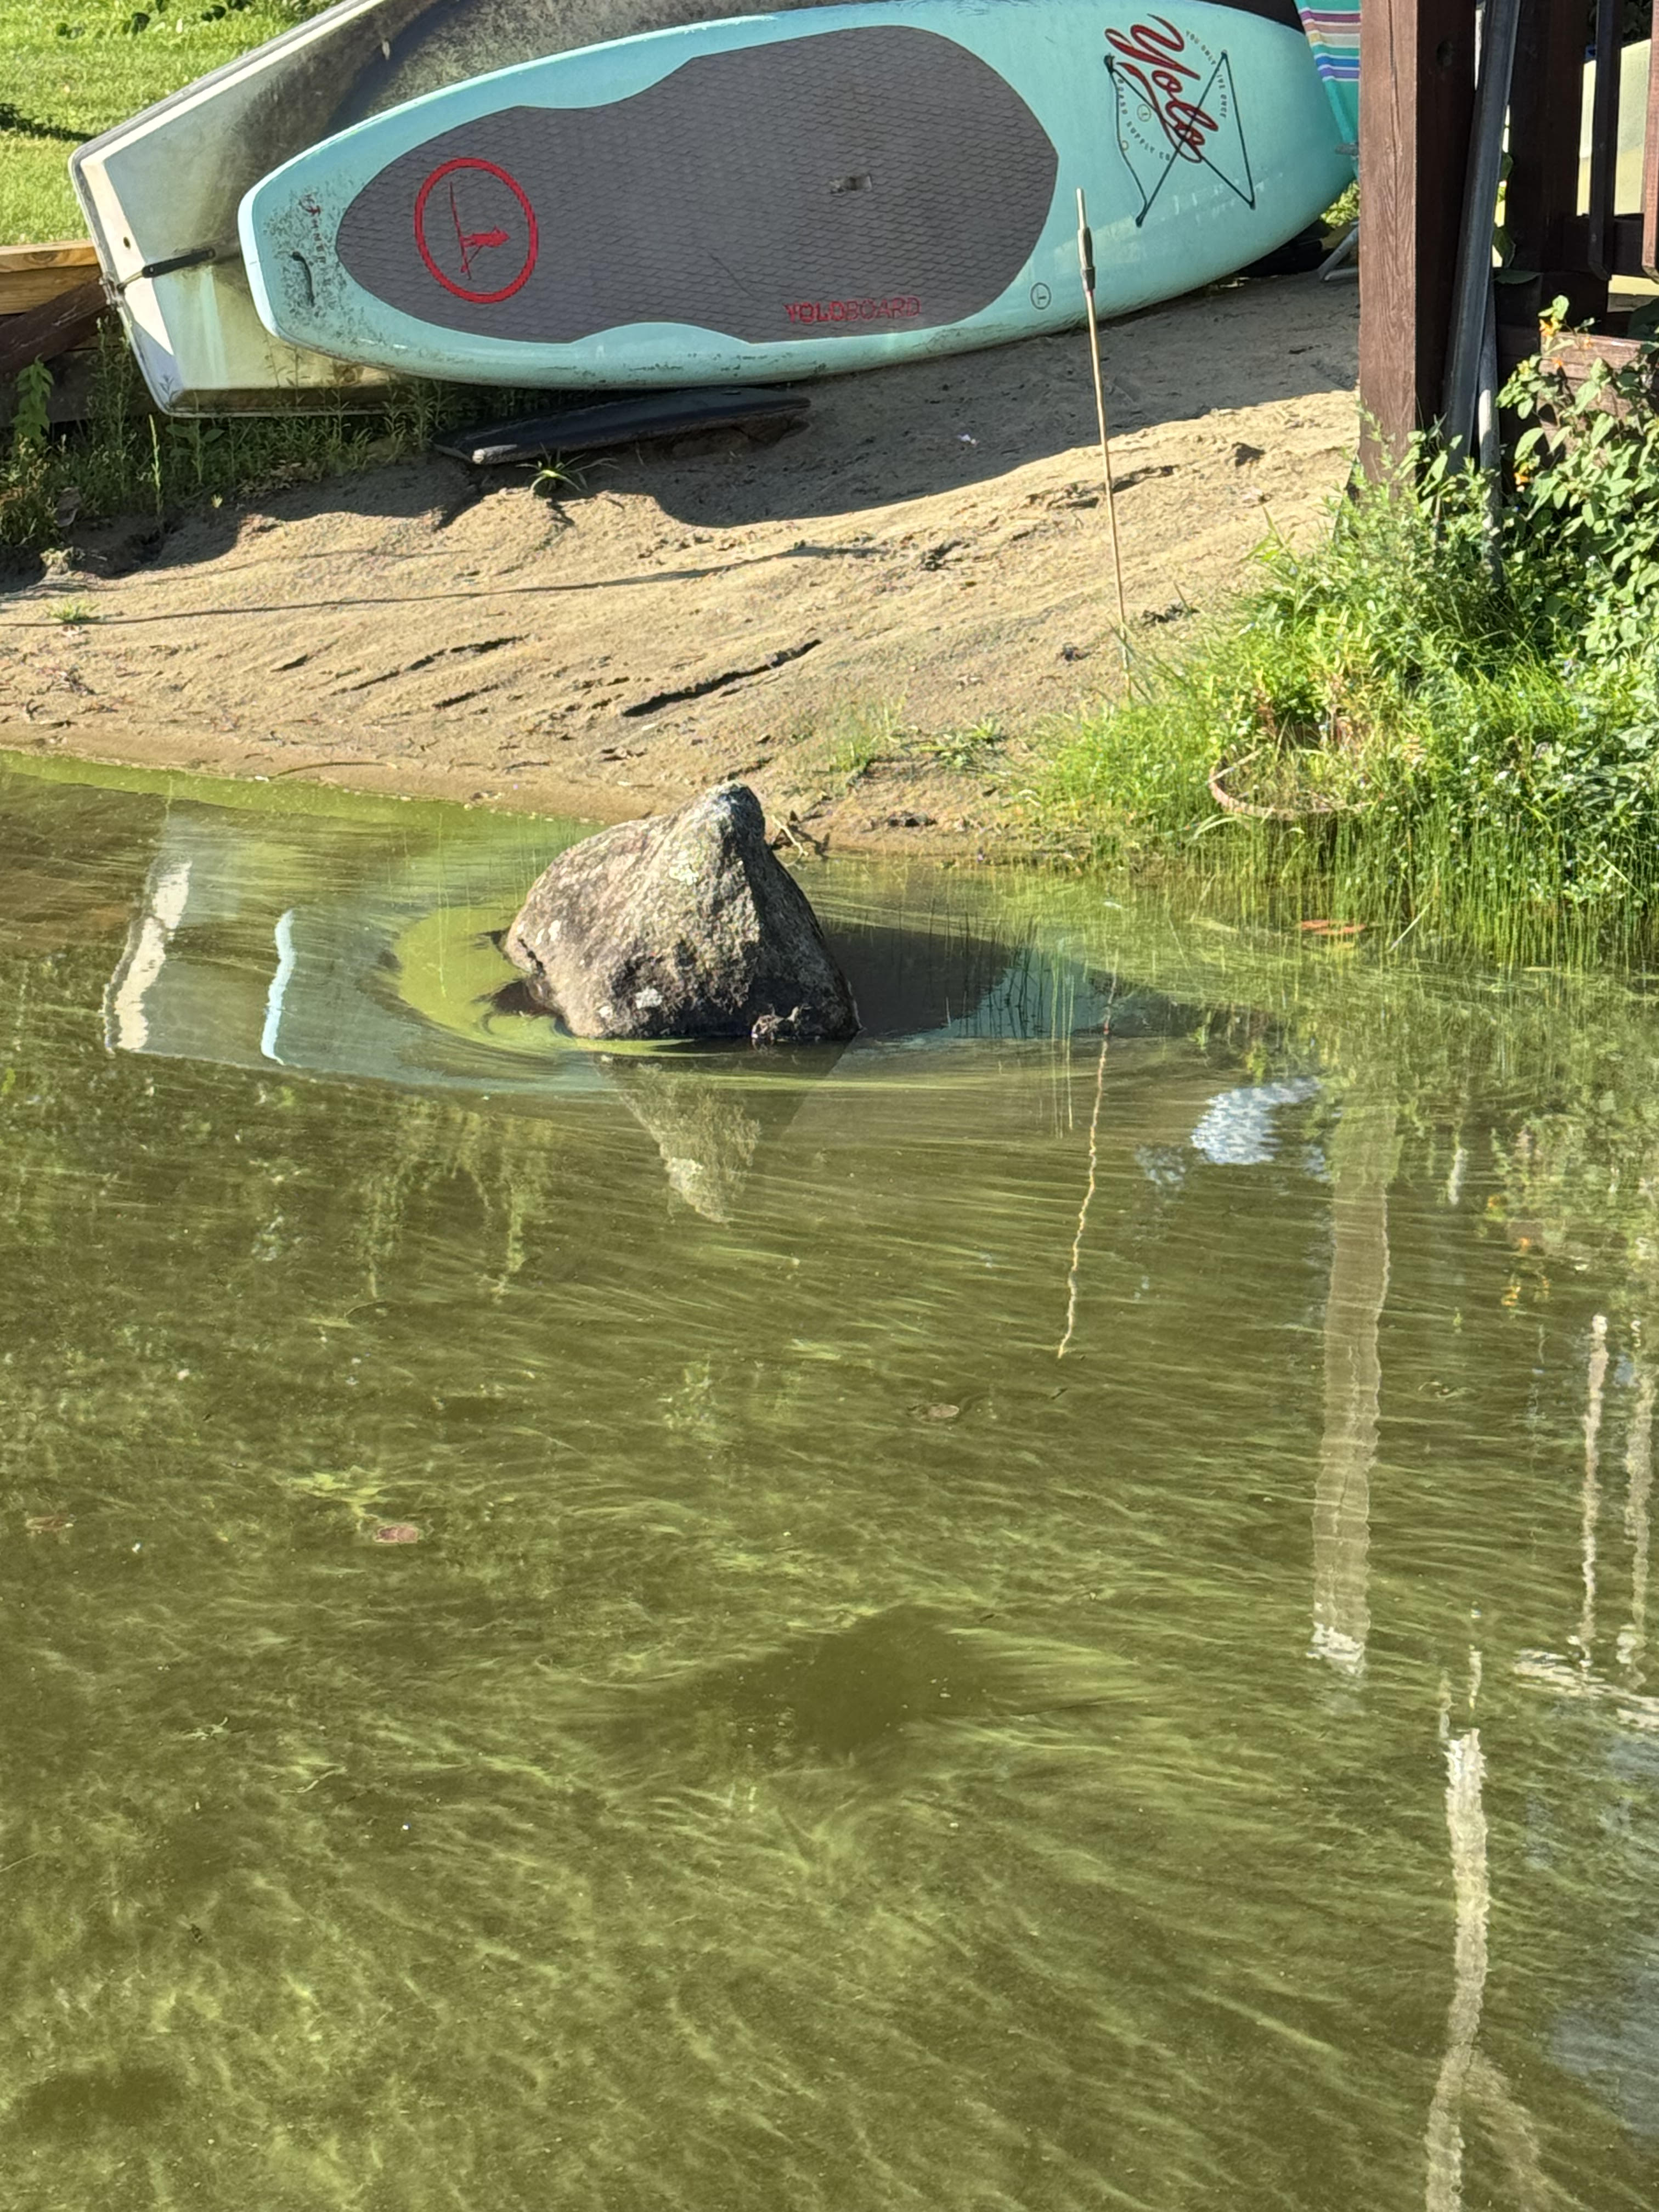
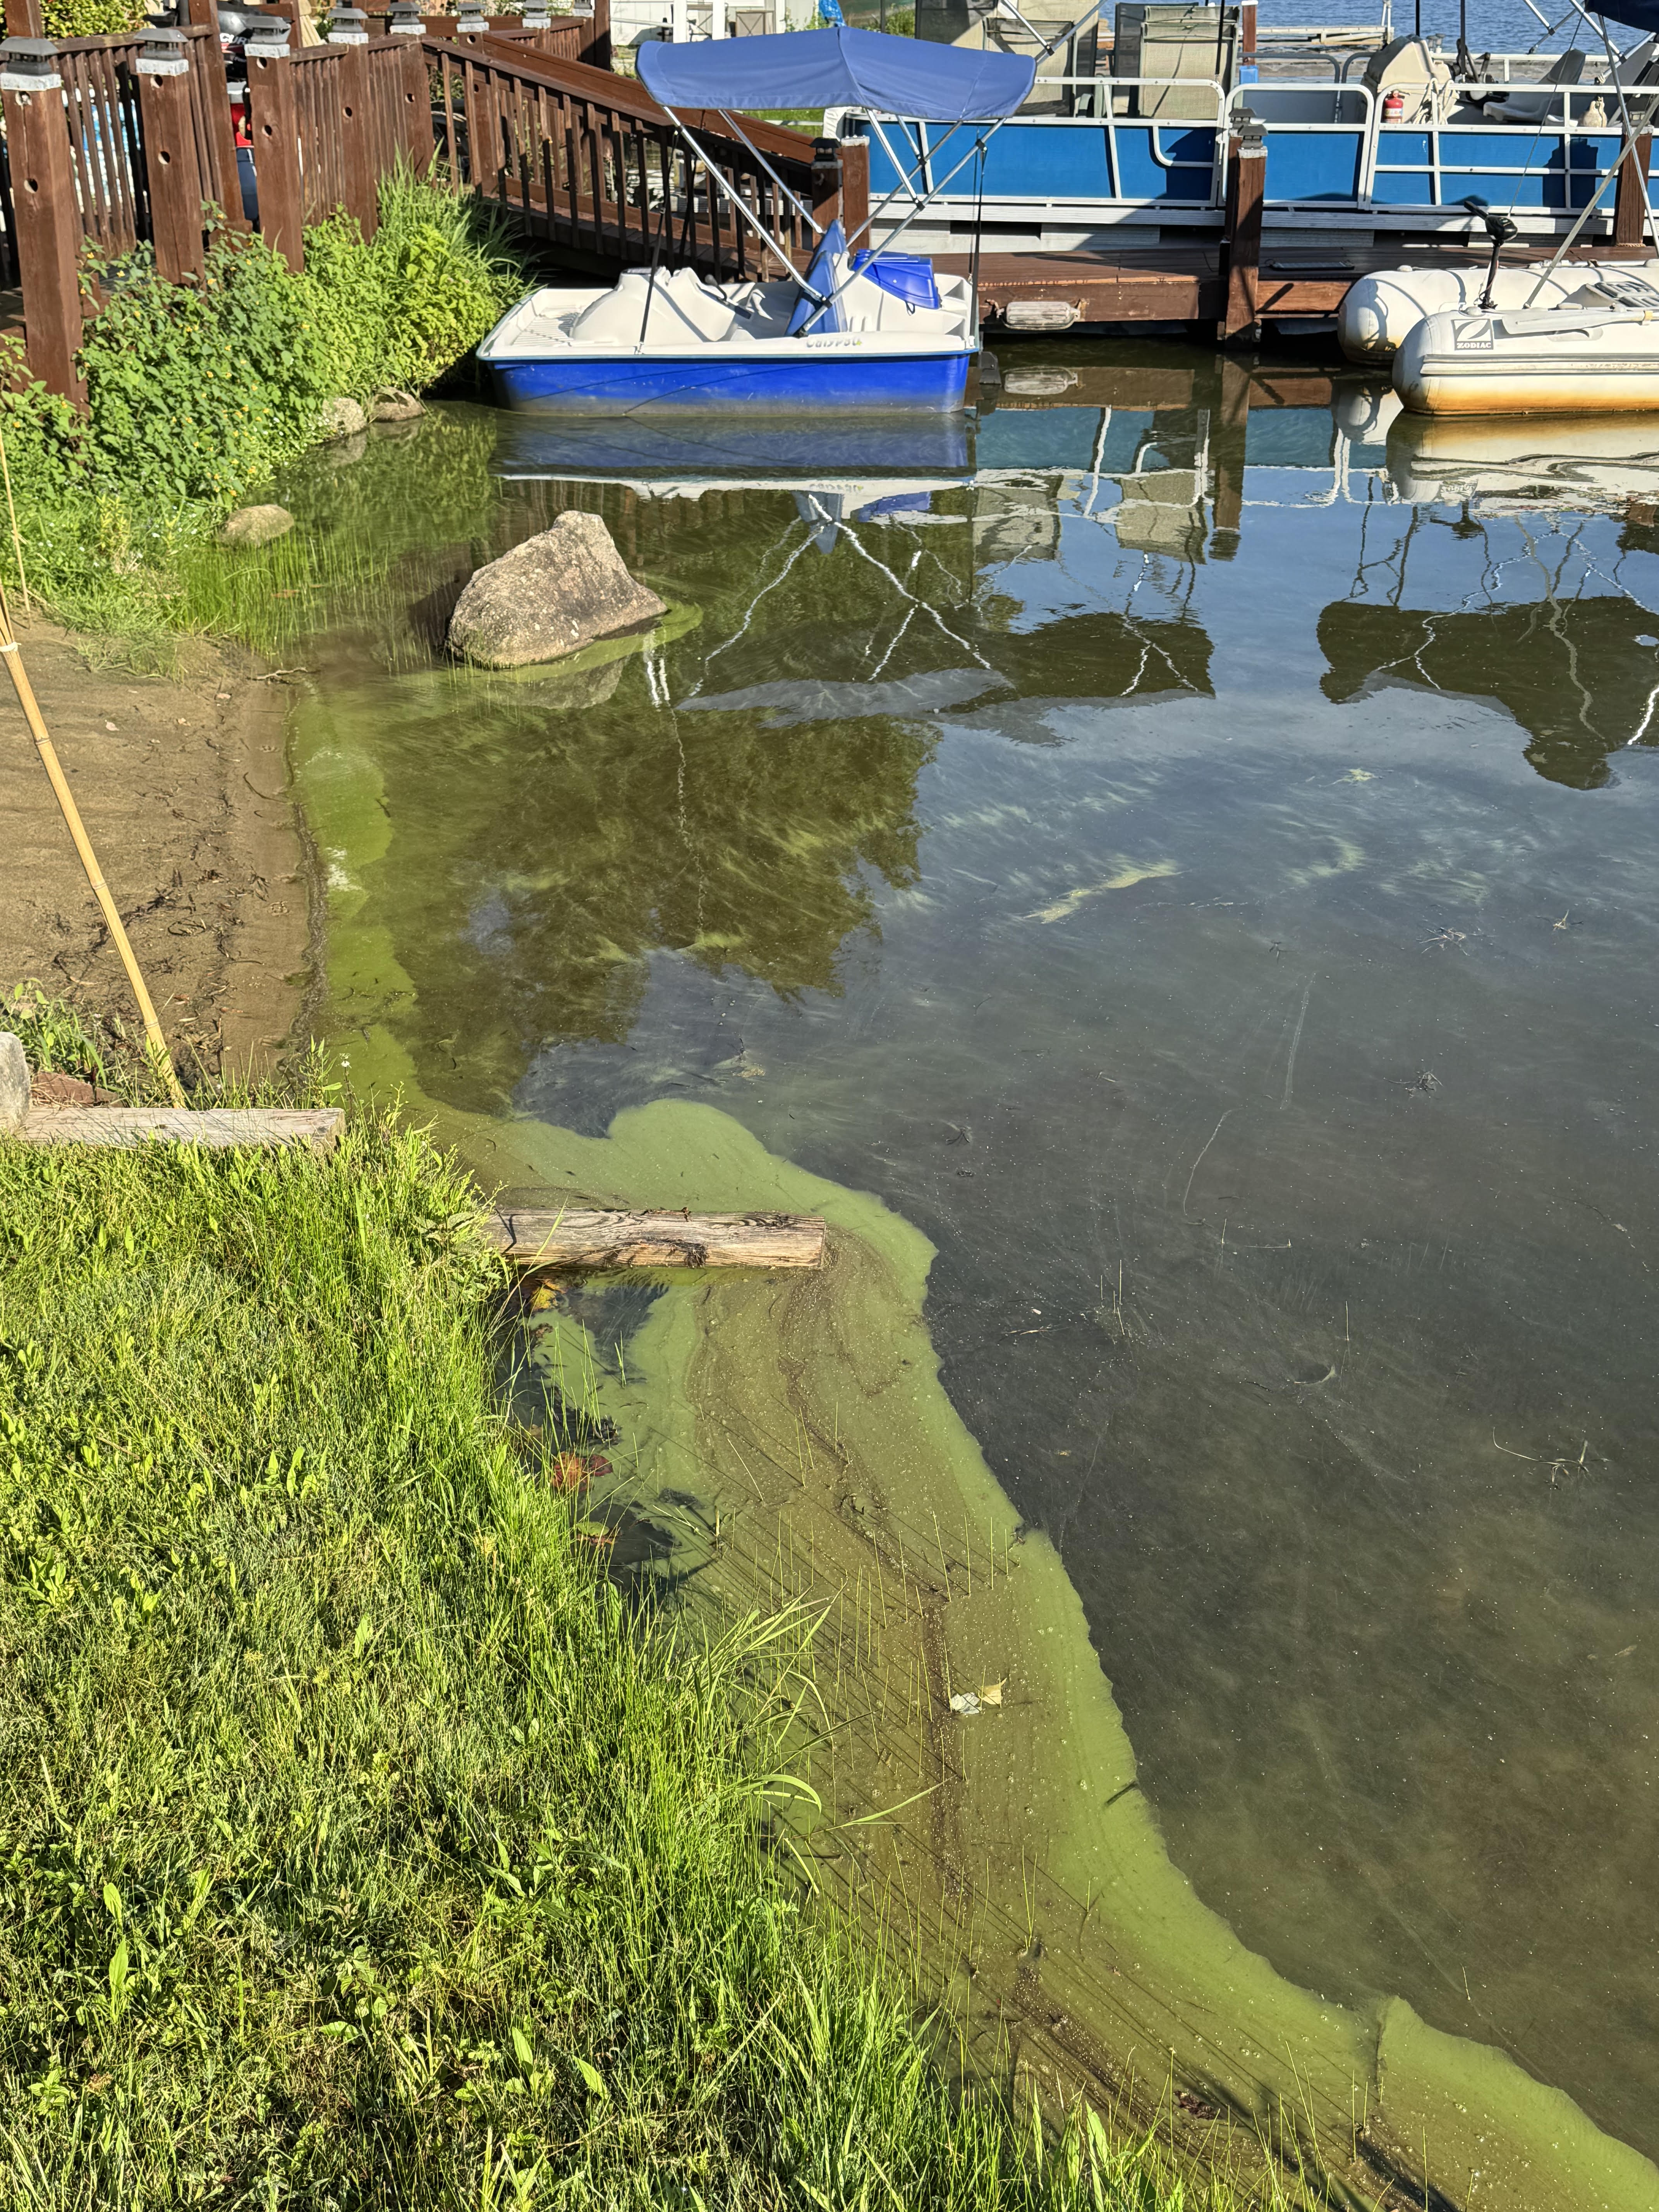
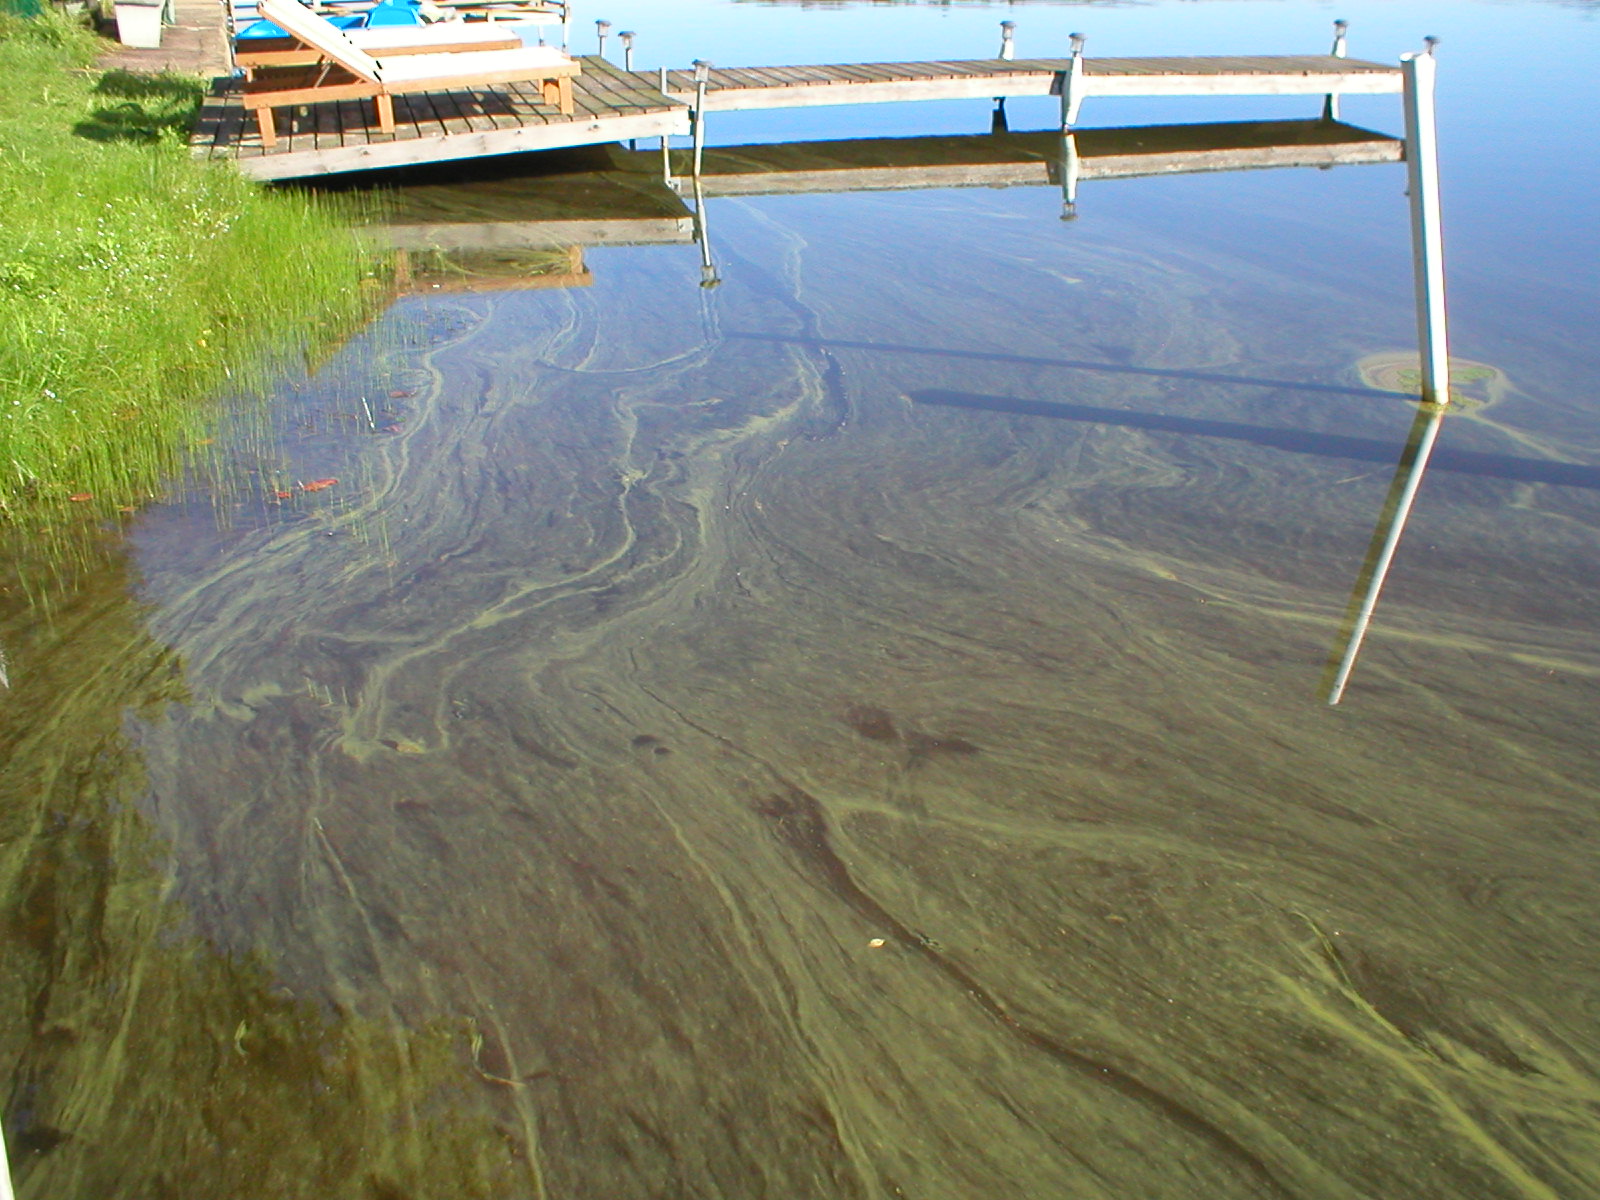
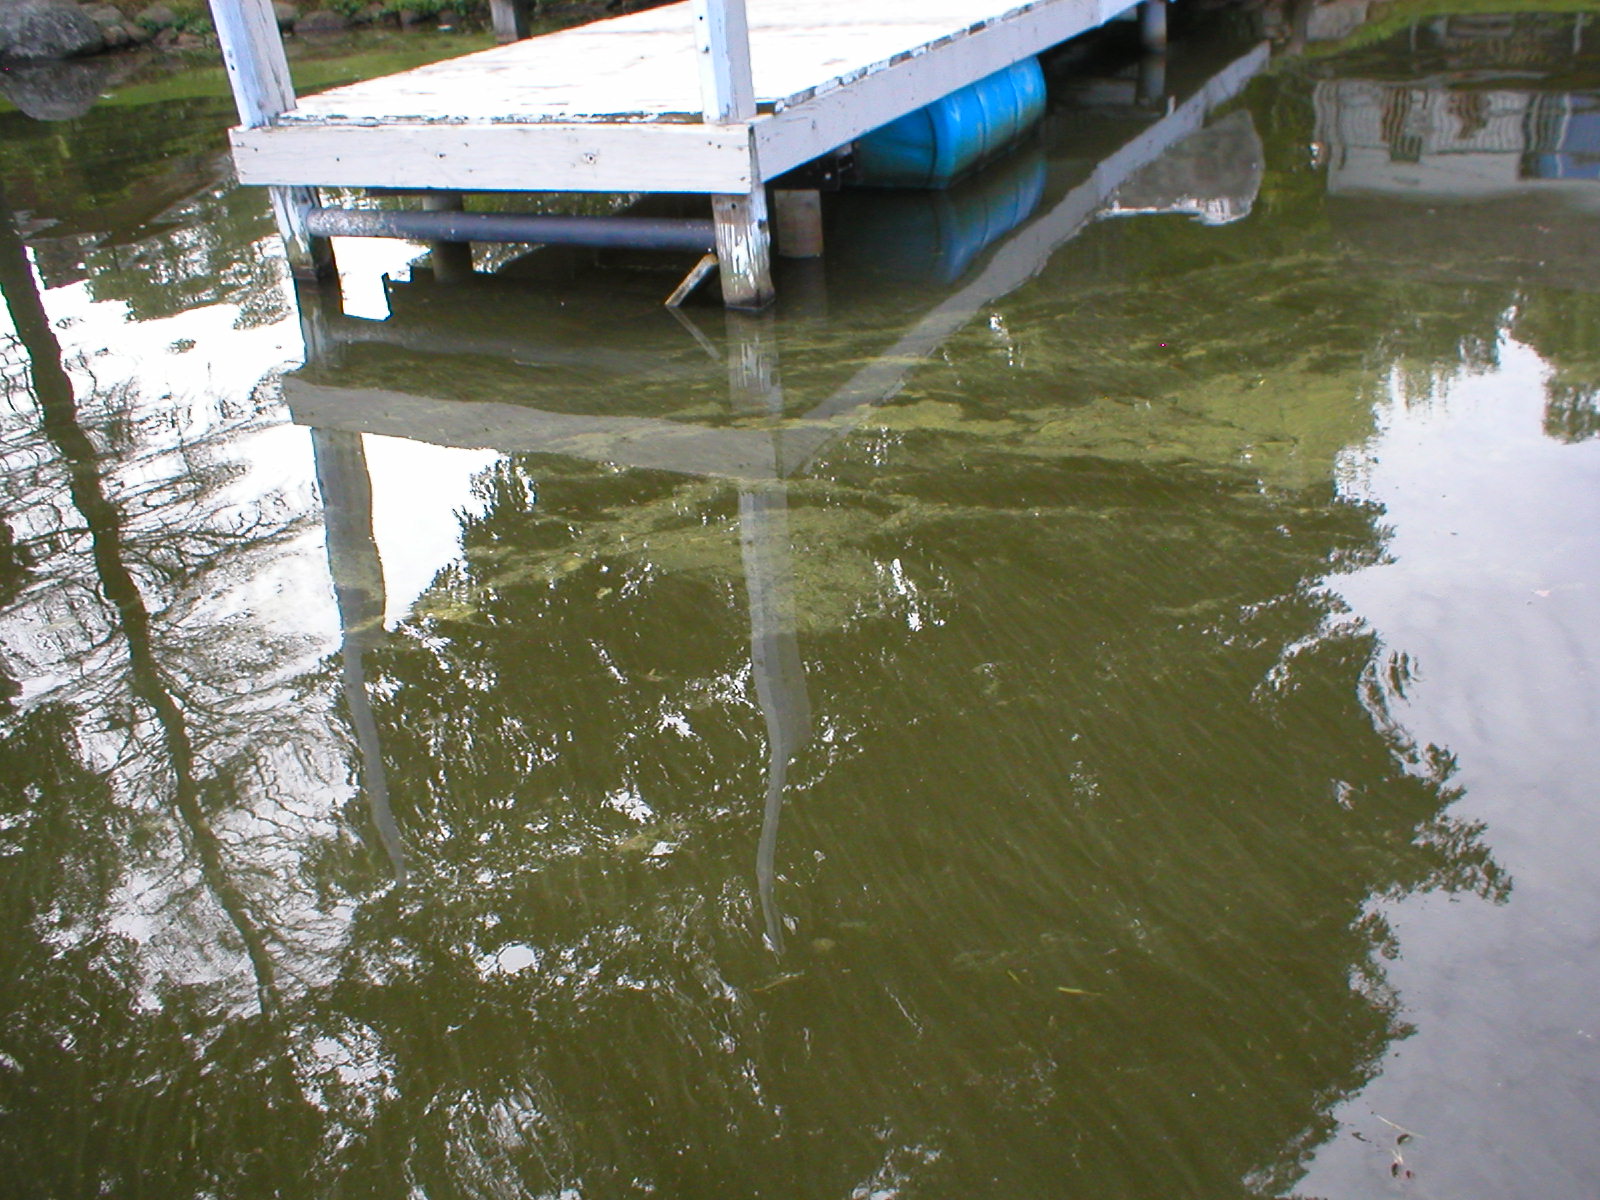
Early surface film collecting along dock pilings and shoreline structure.
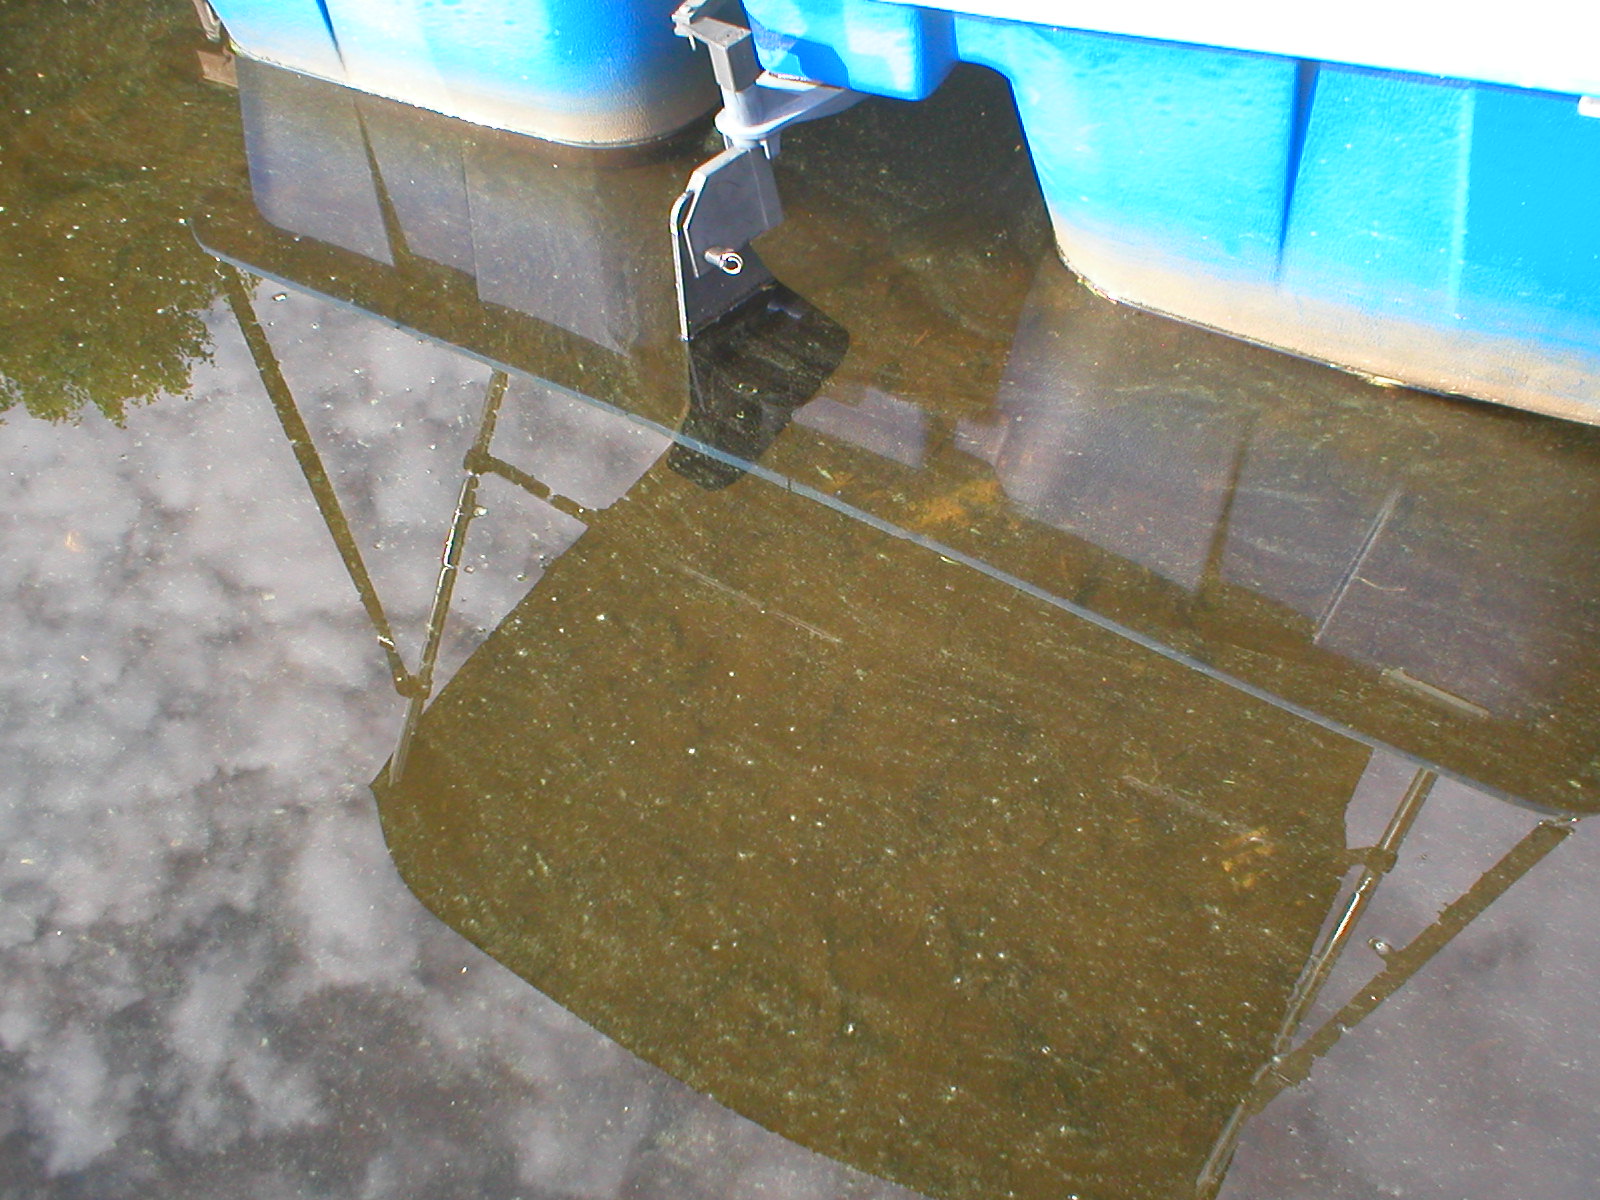
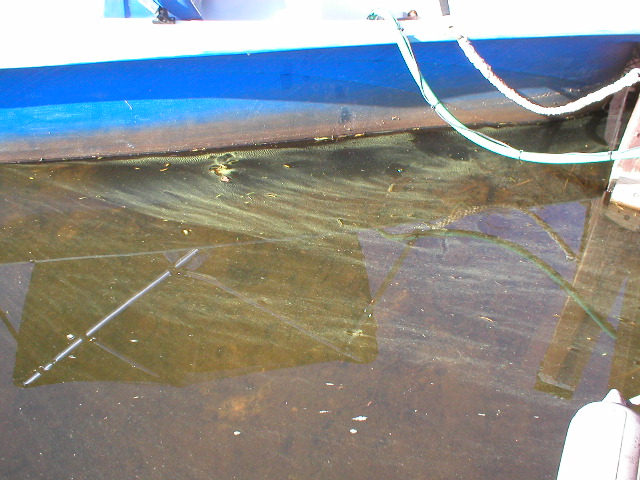
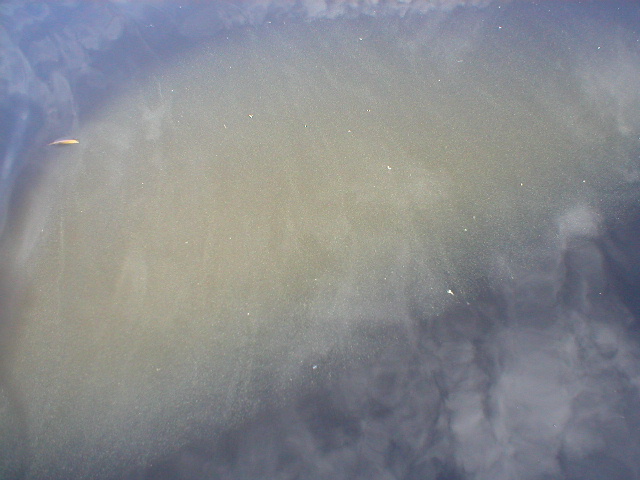
Water column profile displaying suspended micro-colonies beneath surface.
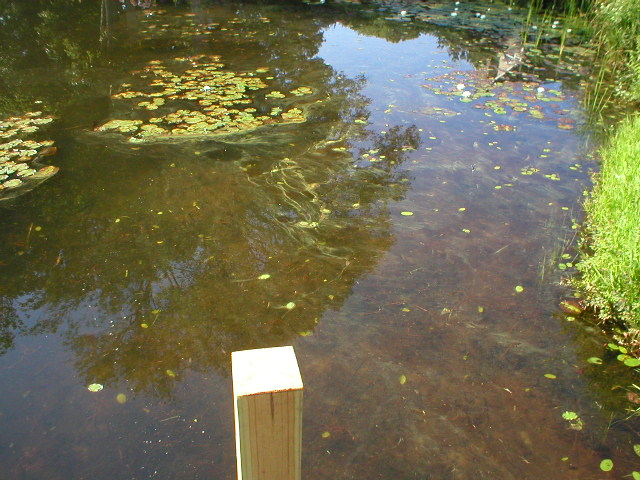
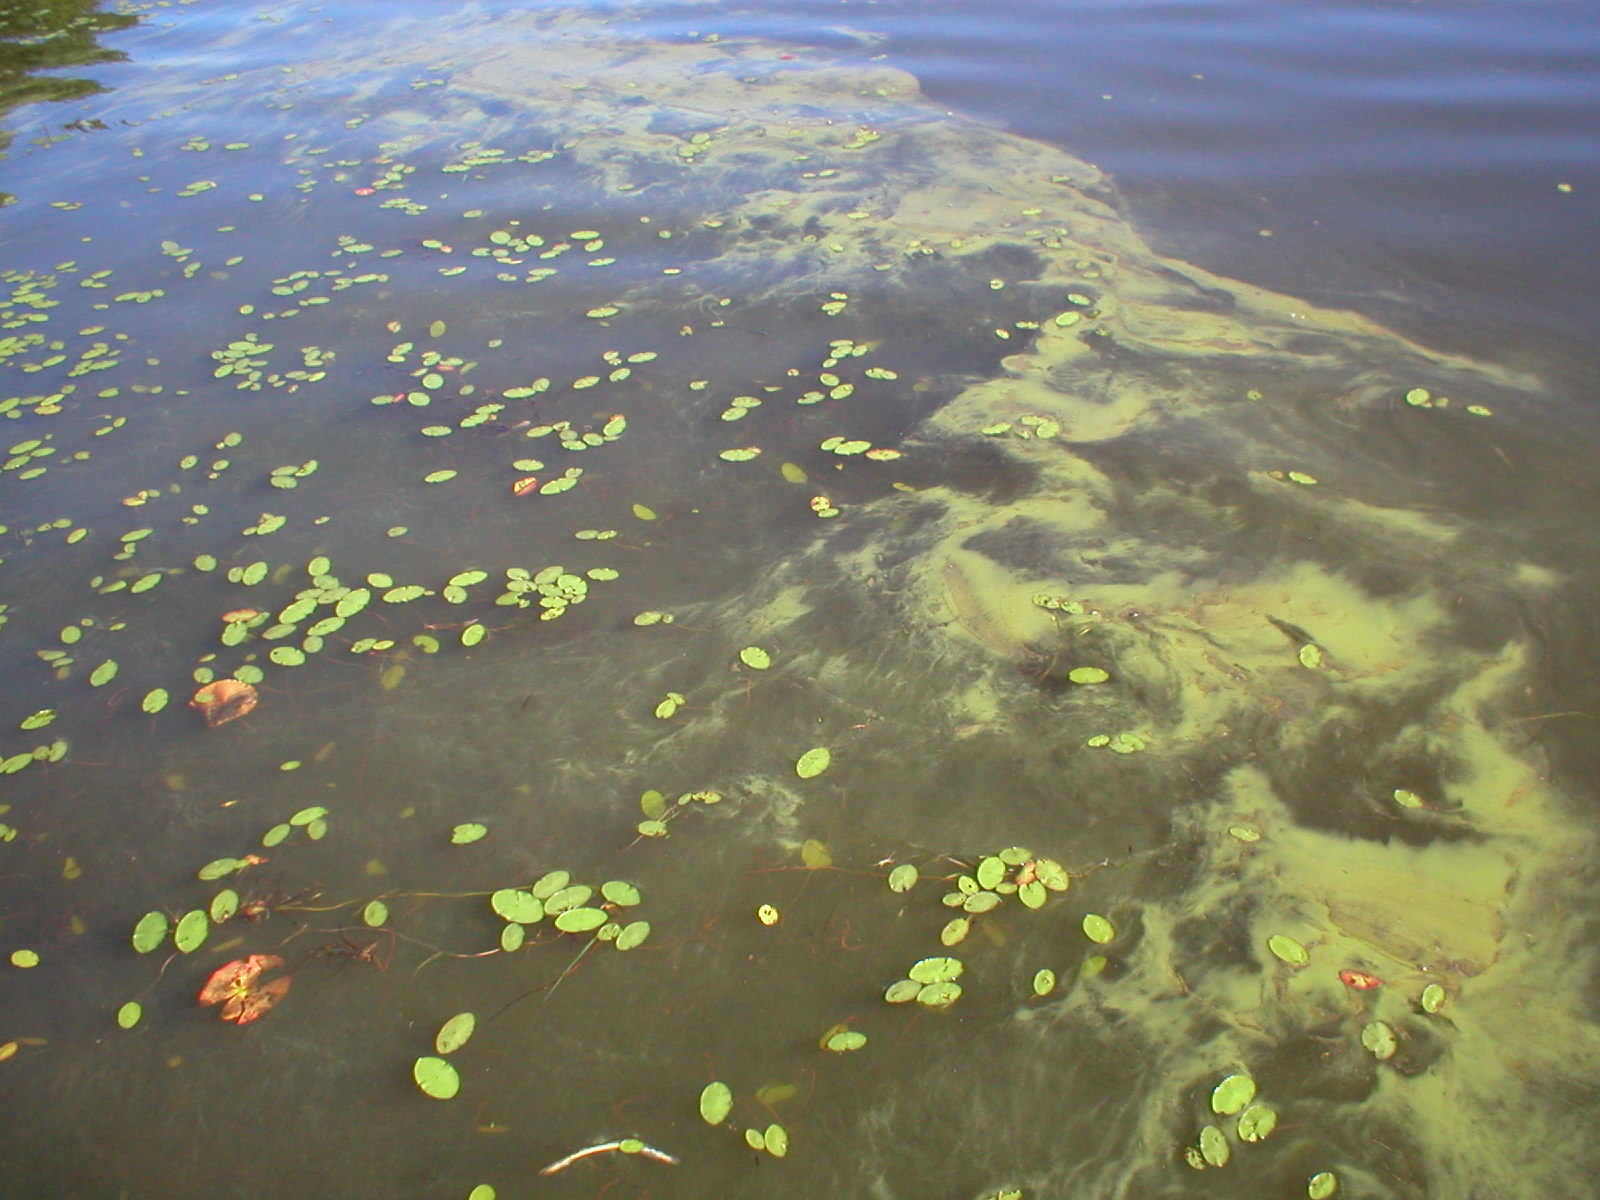
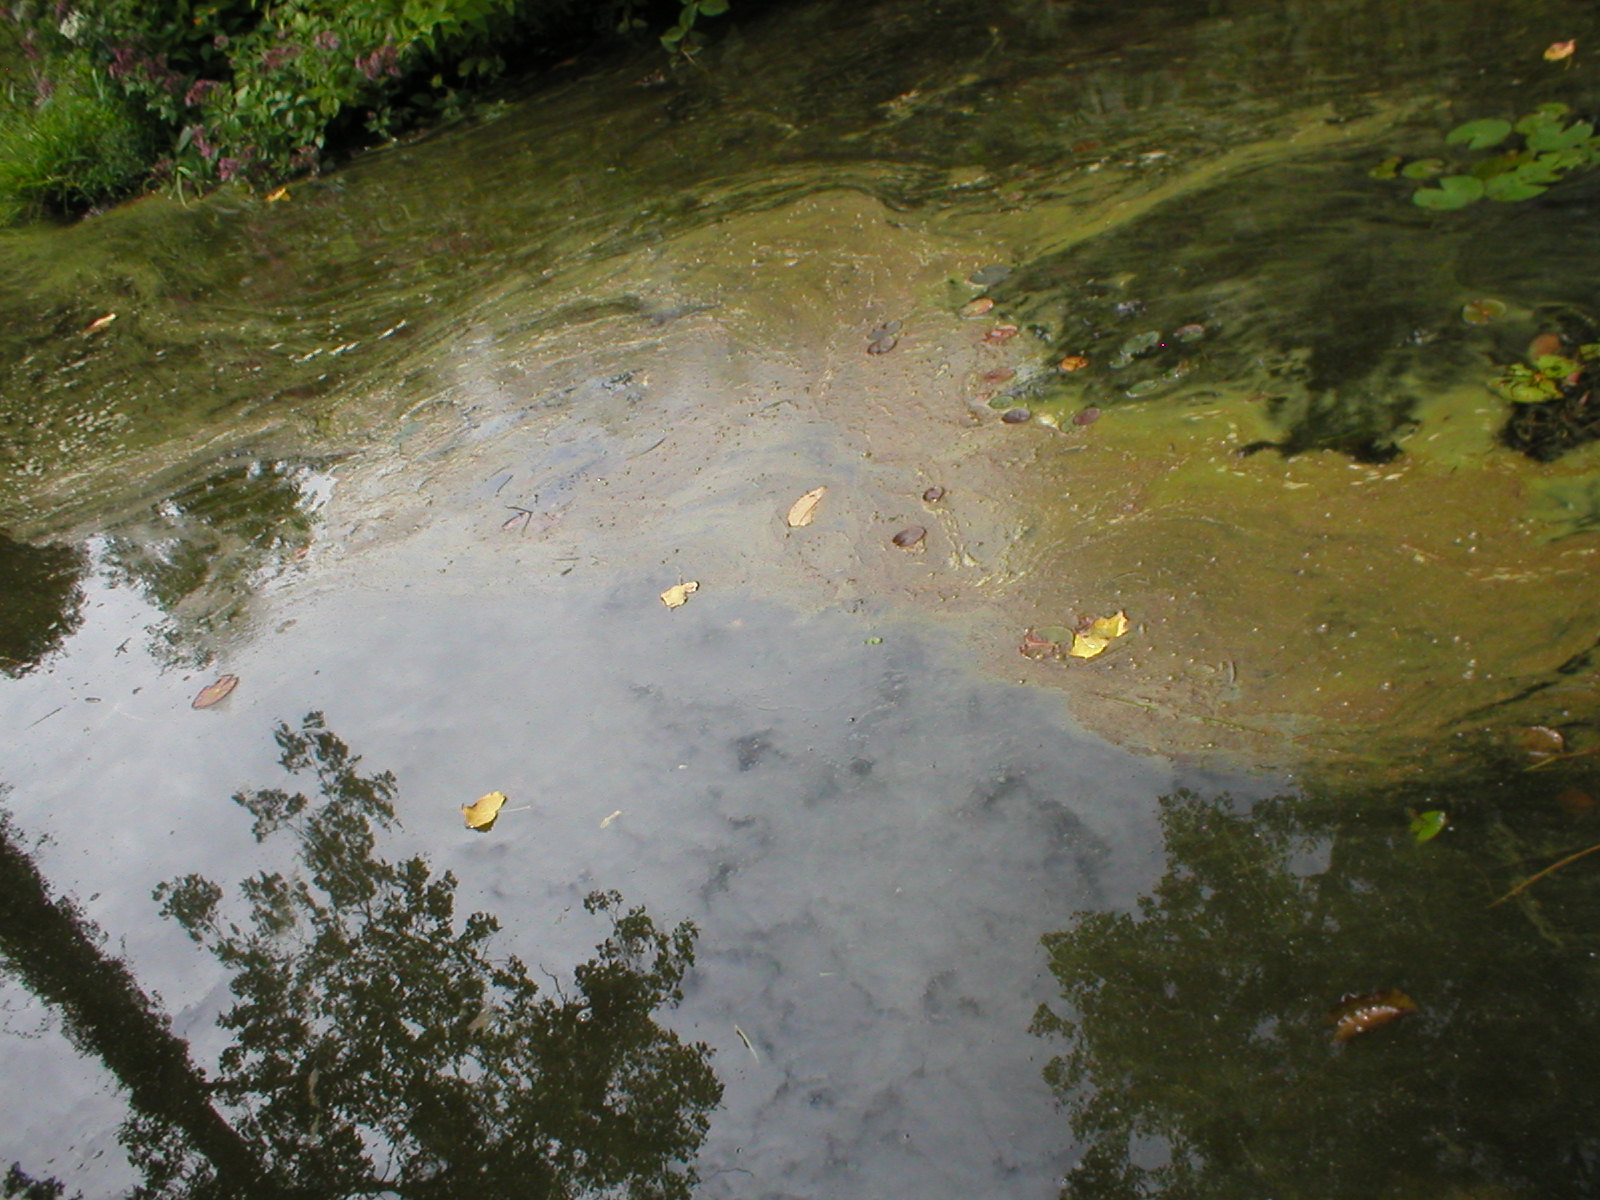
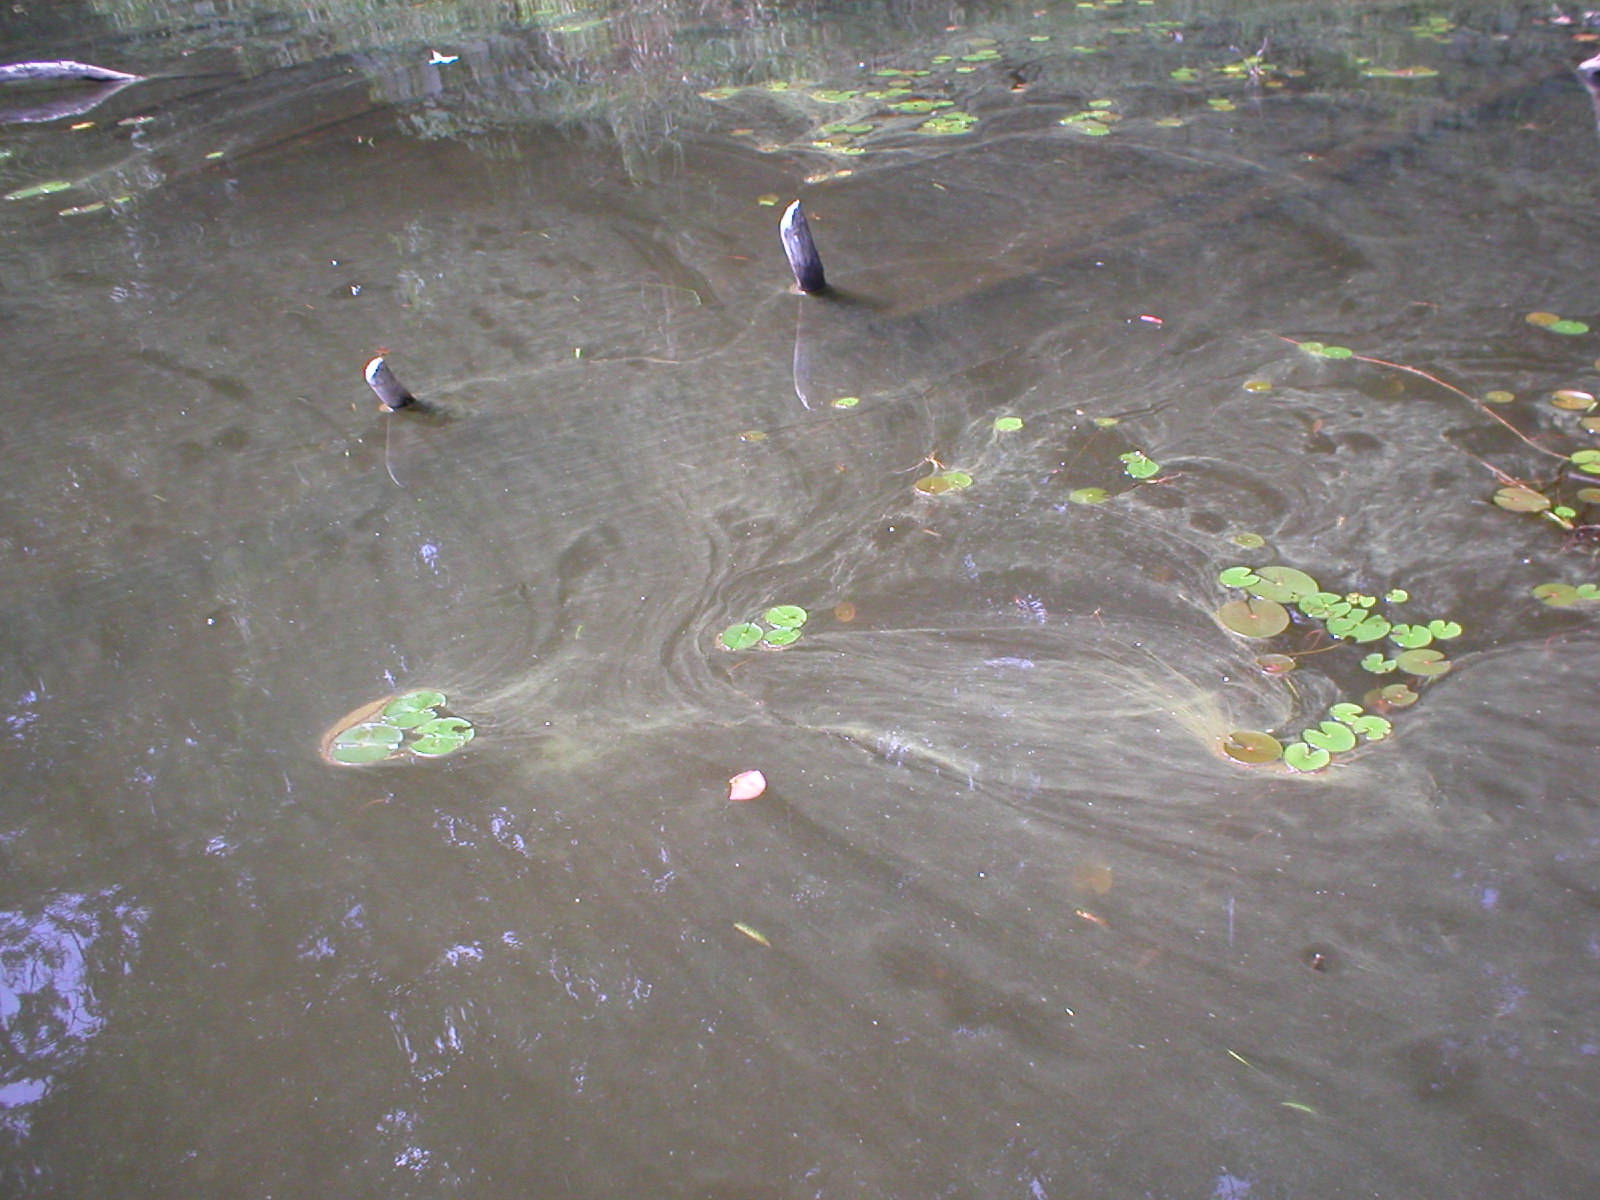
Floating-leaf vegetative fringe showing initial entrapment of green film.
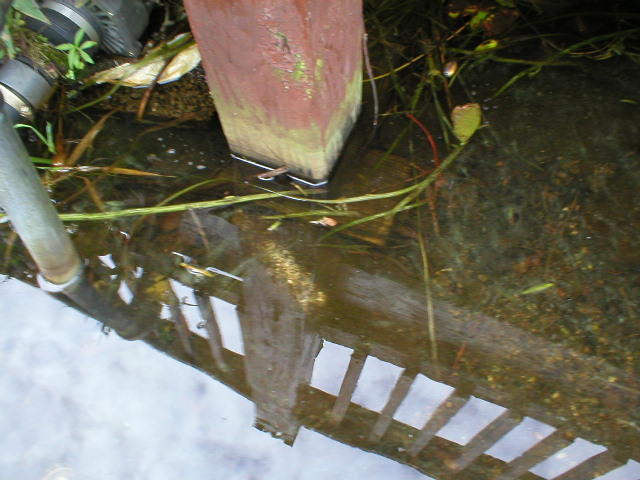
Shoreline bank perspective showing water line contact point.
August 5
5 Photos
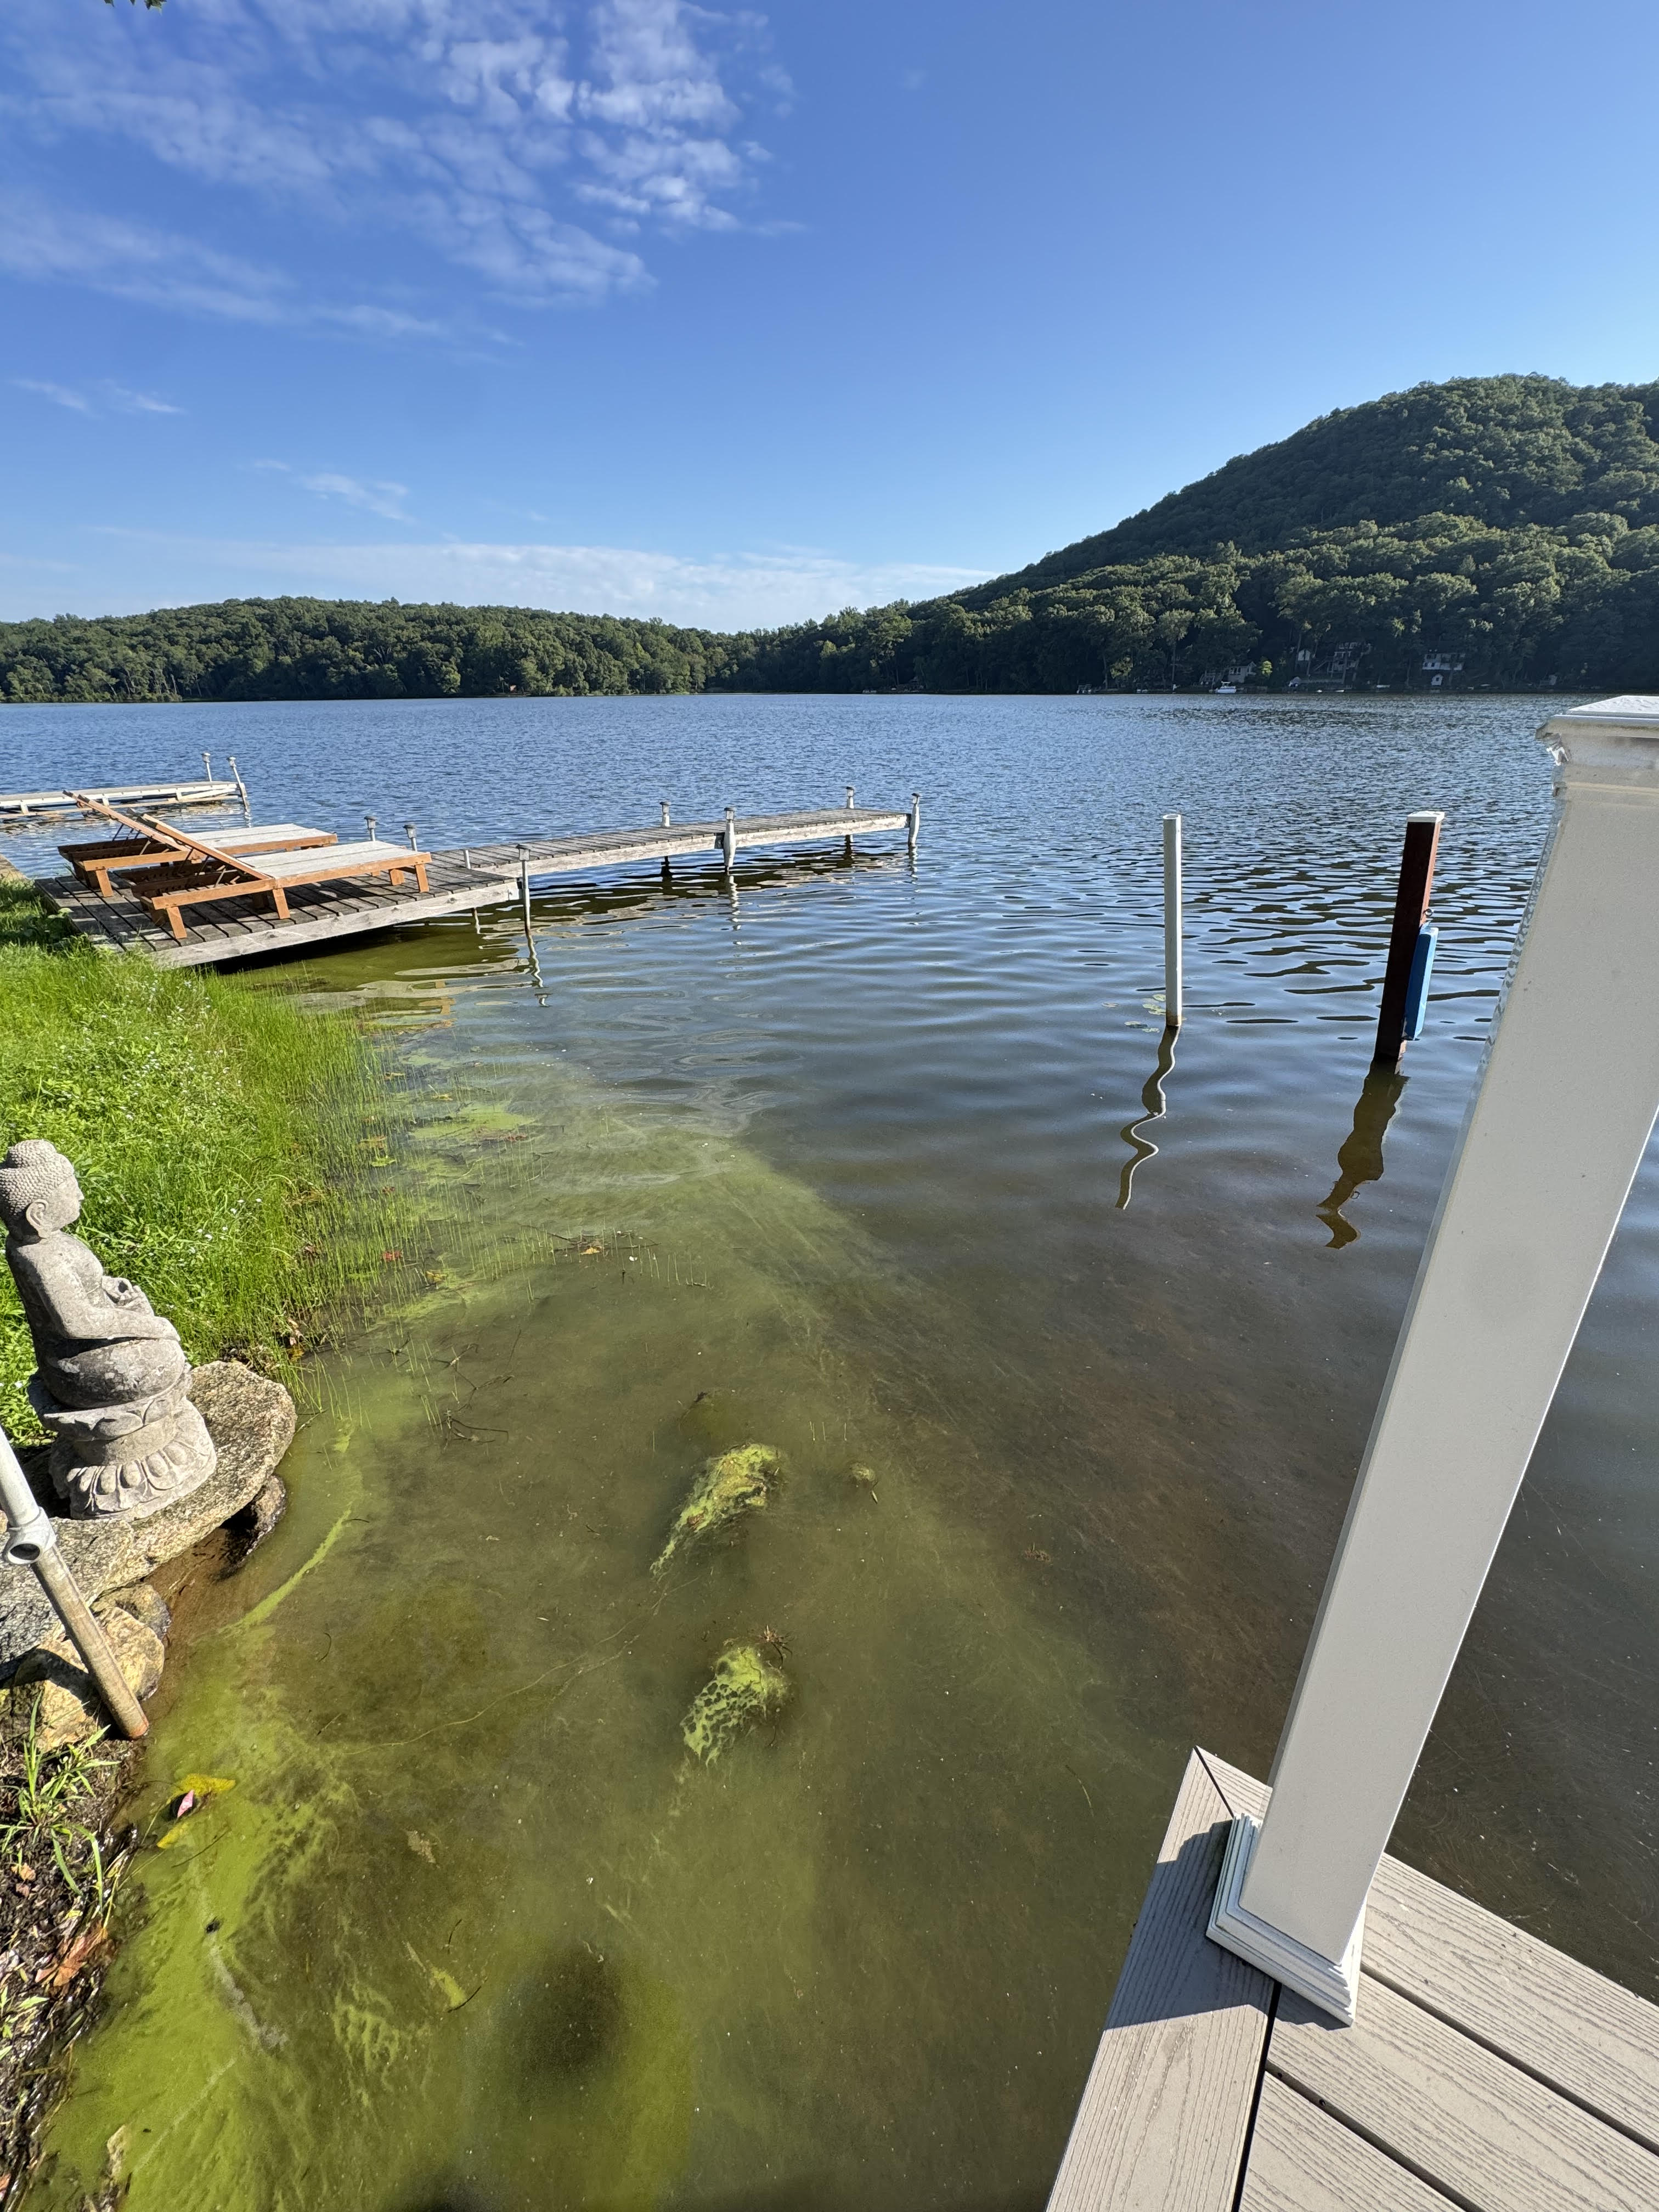
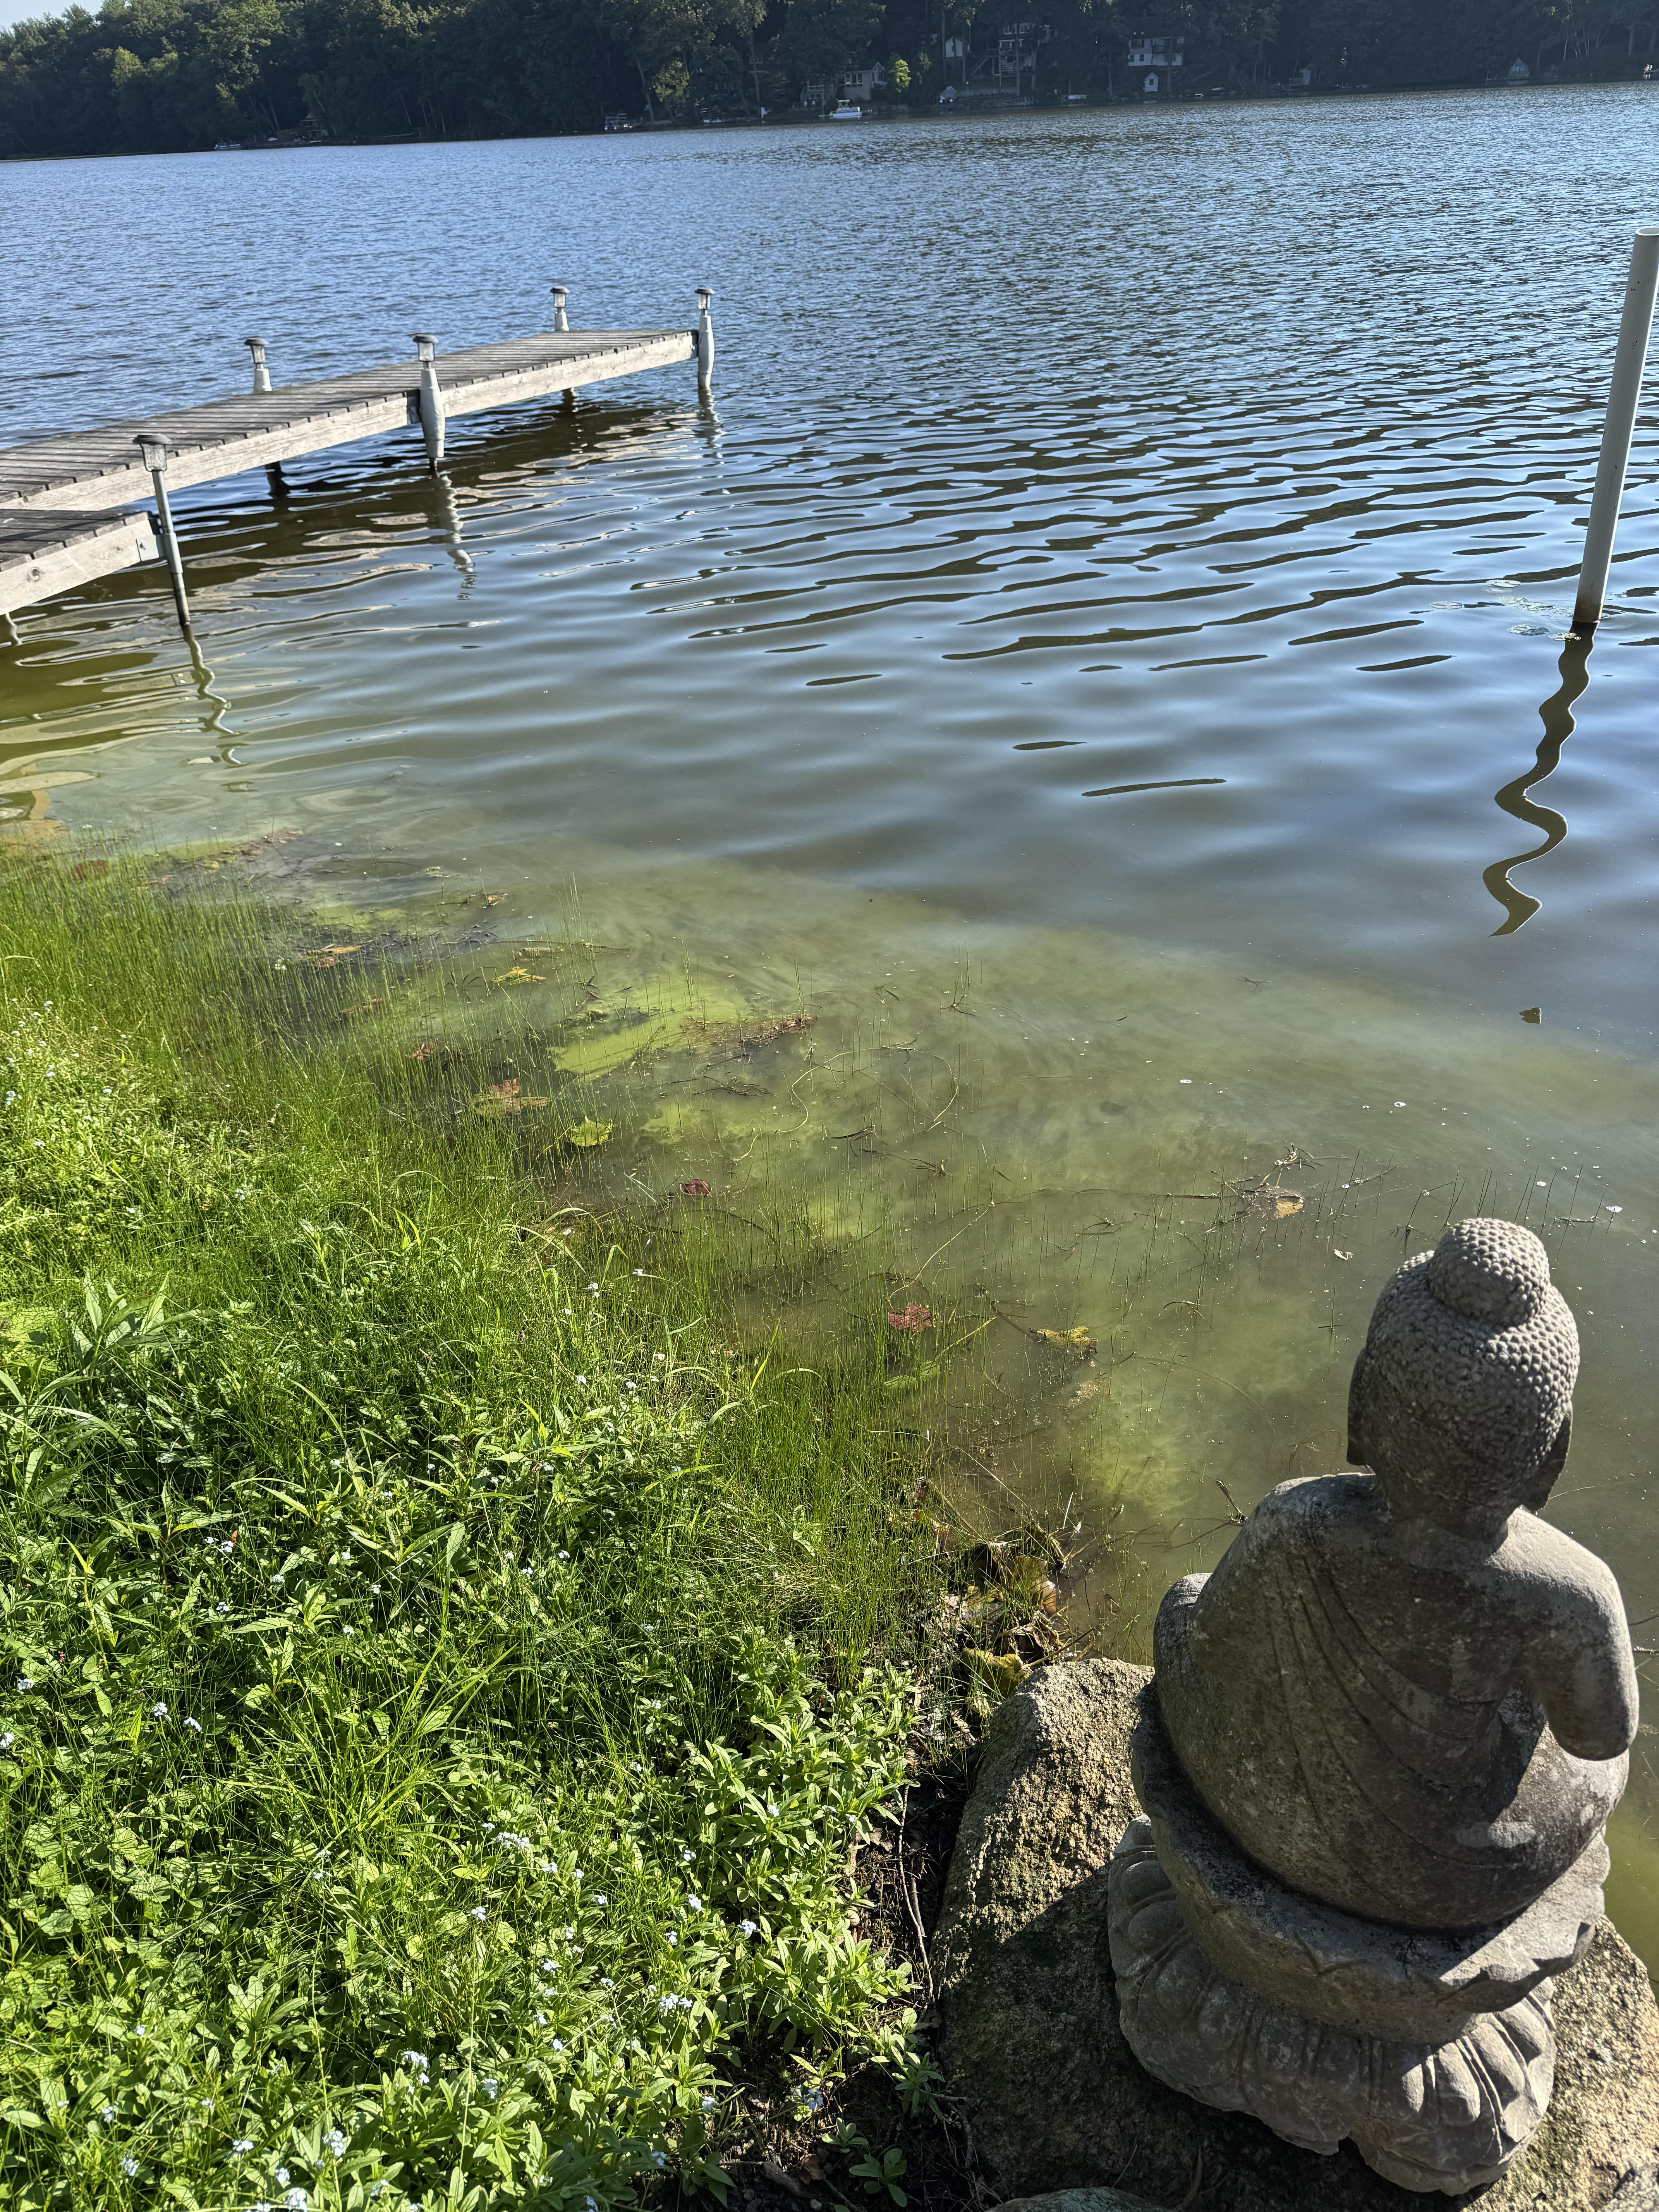
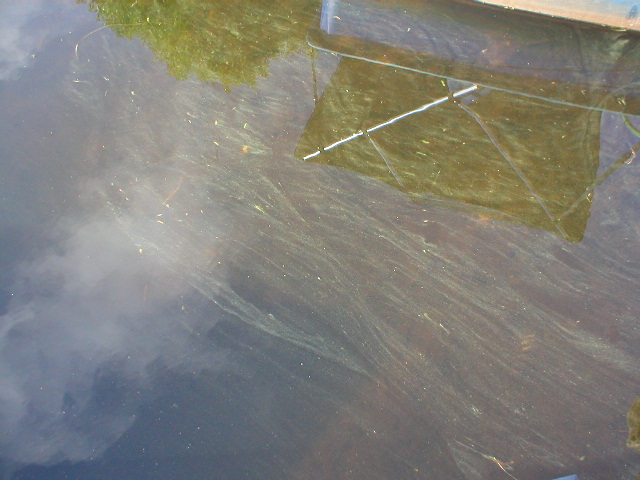
Noticeable thickening of surface accumulation. Streaking patterns emerge across quiet surface areas with rising midday water temperatures.
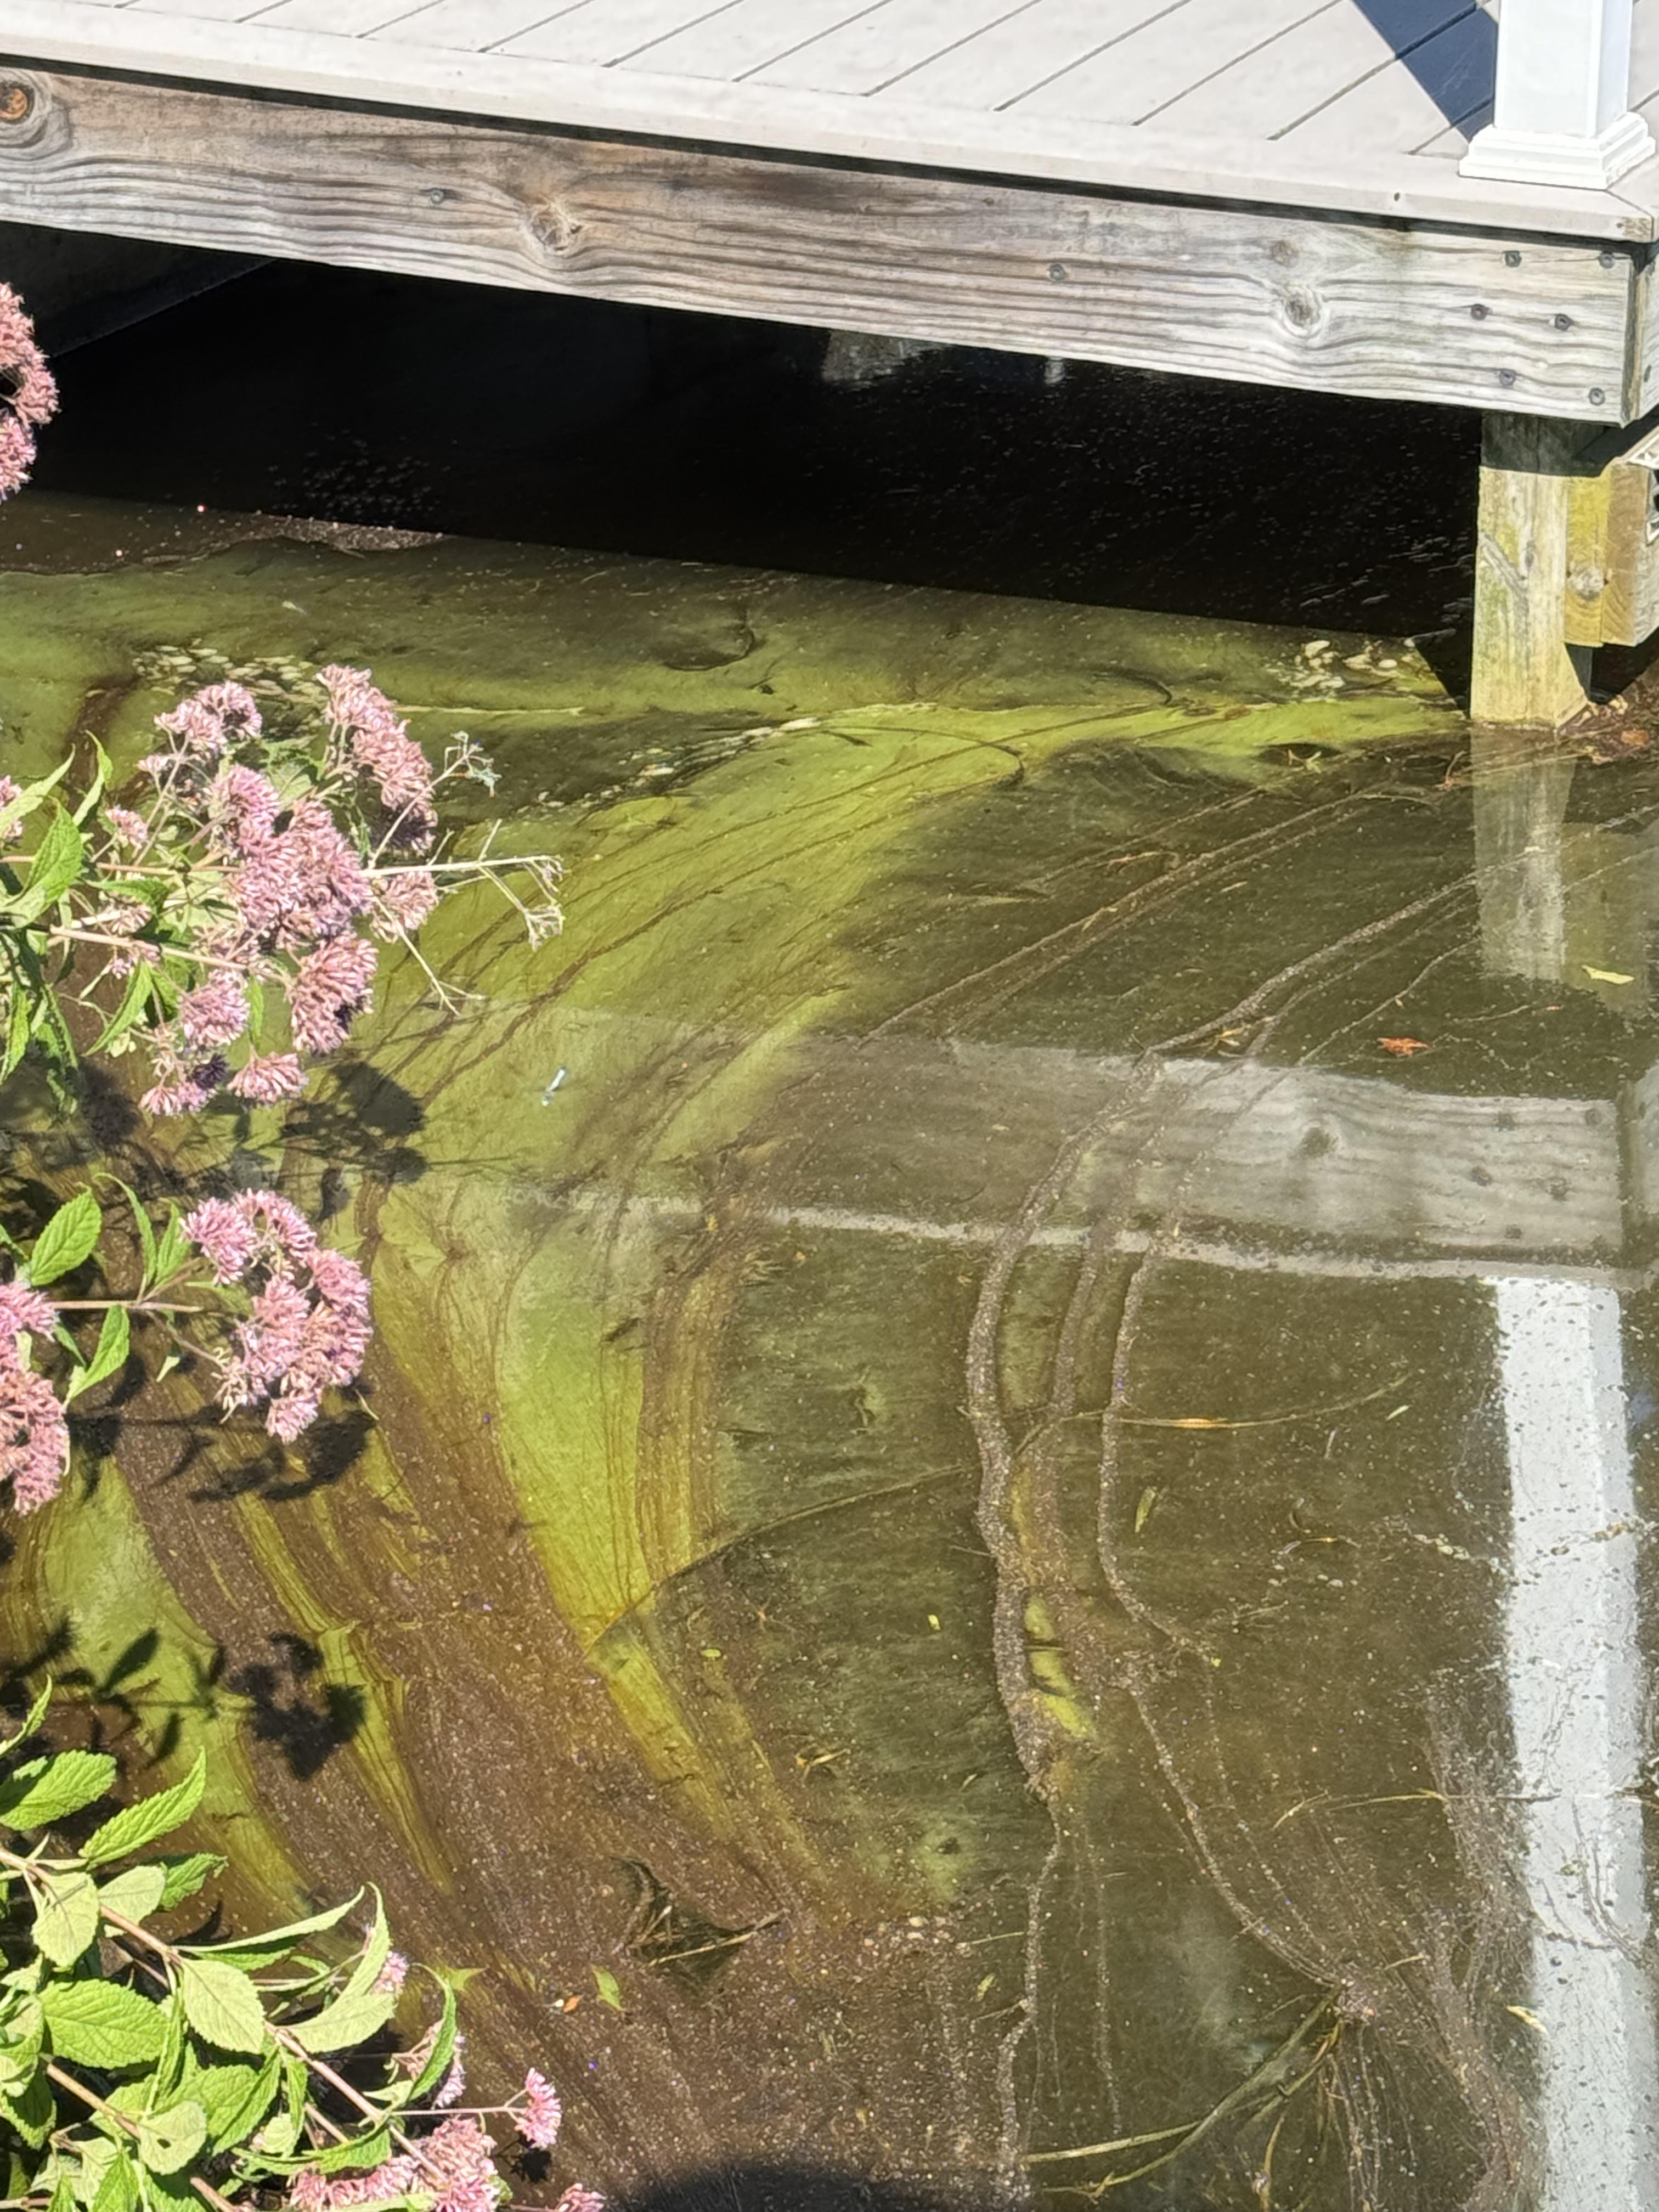
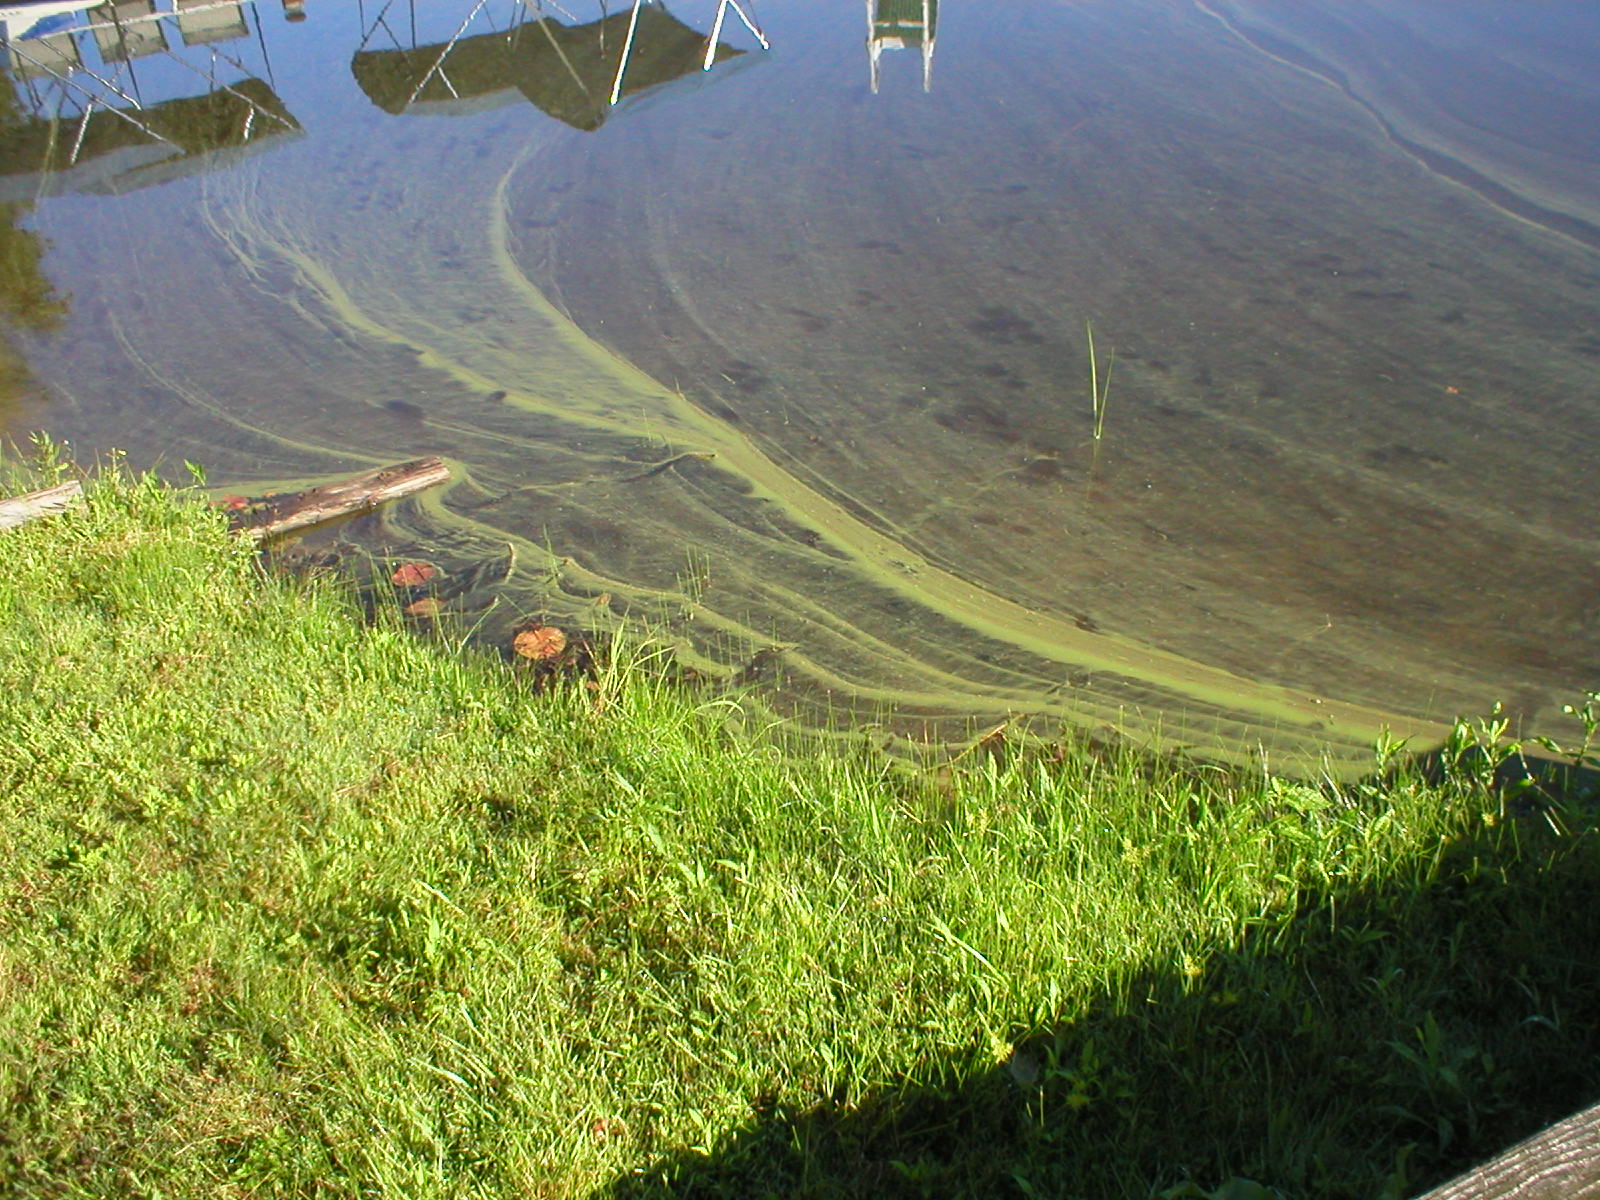
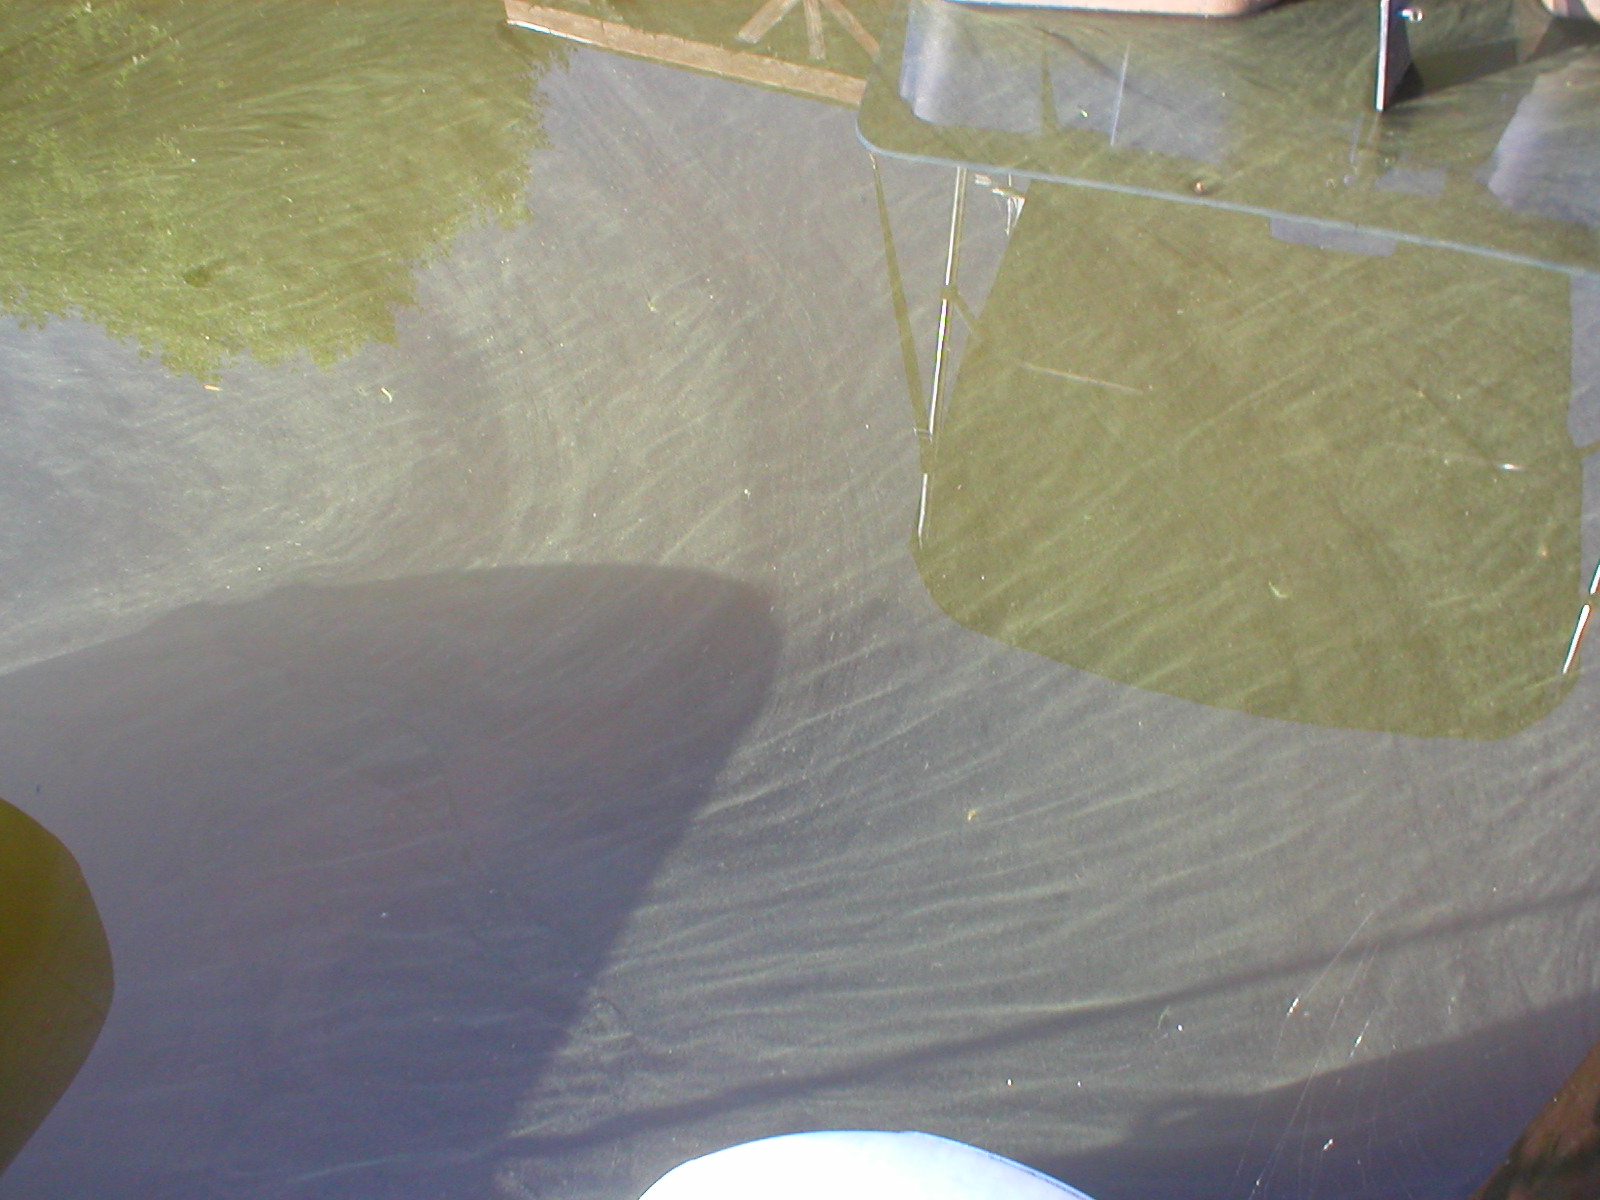
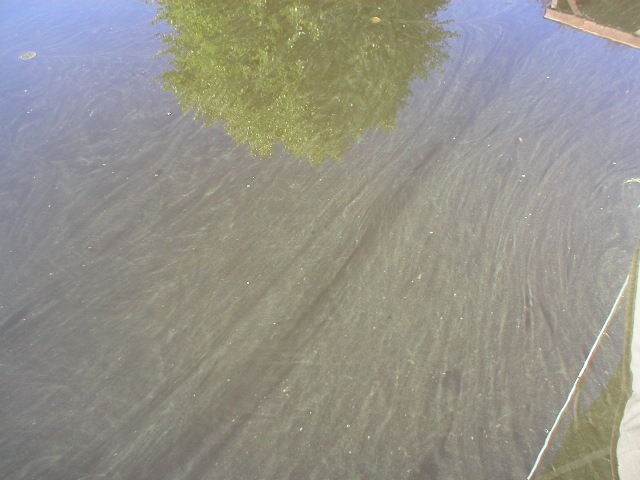
Shoreline sweep showing extended parallel bands of green film.
Surface scum concentrating in protected corner pockets along the dock.
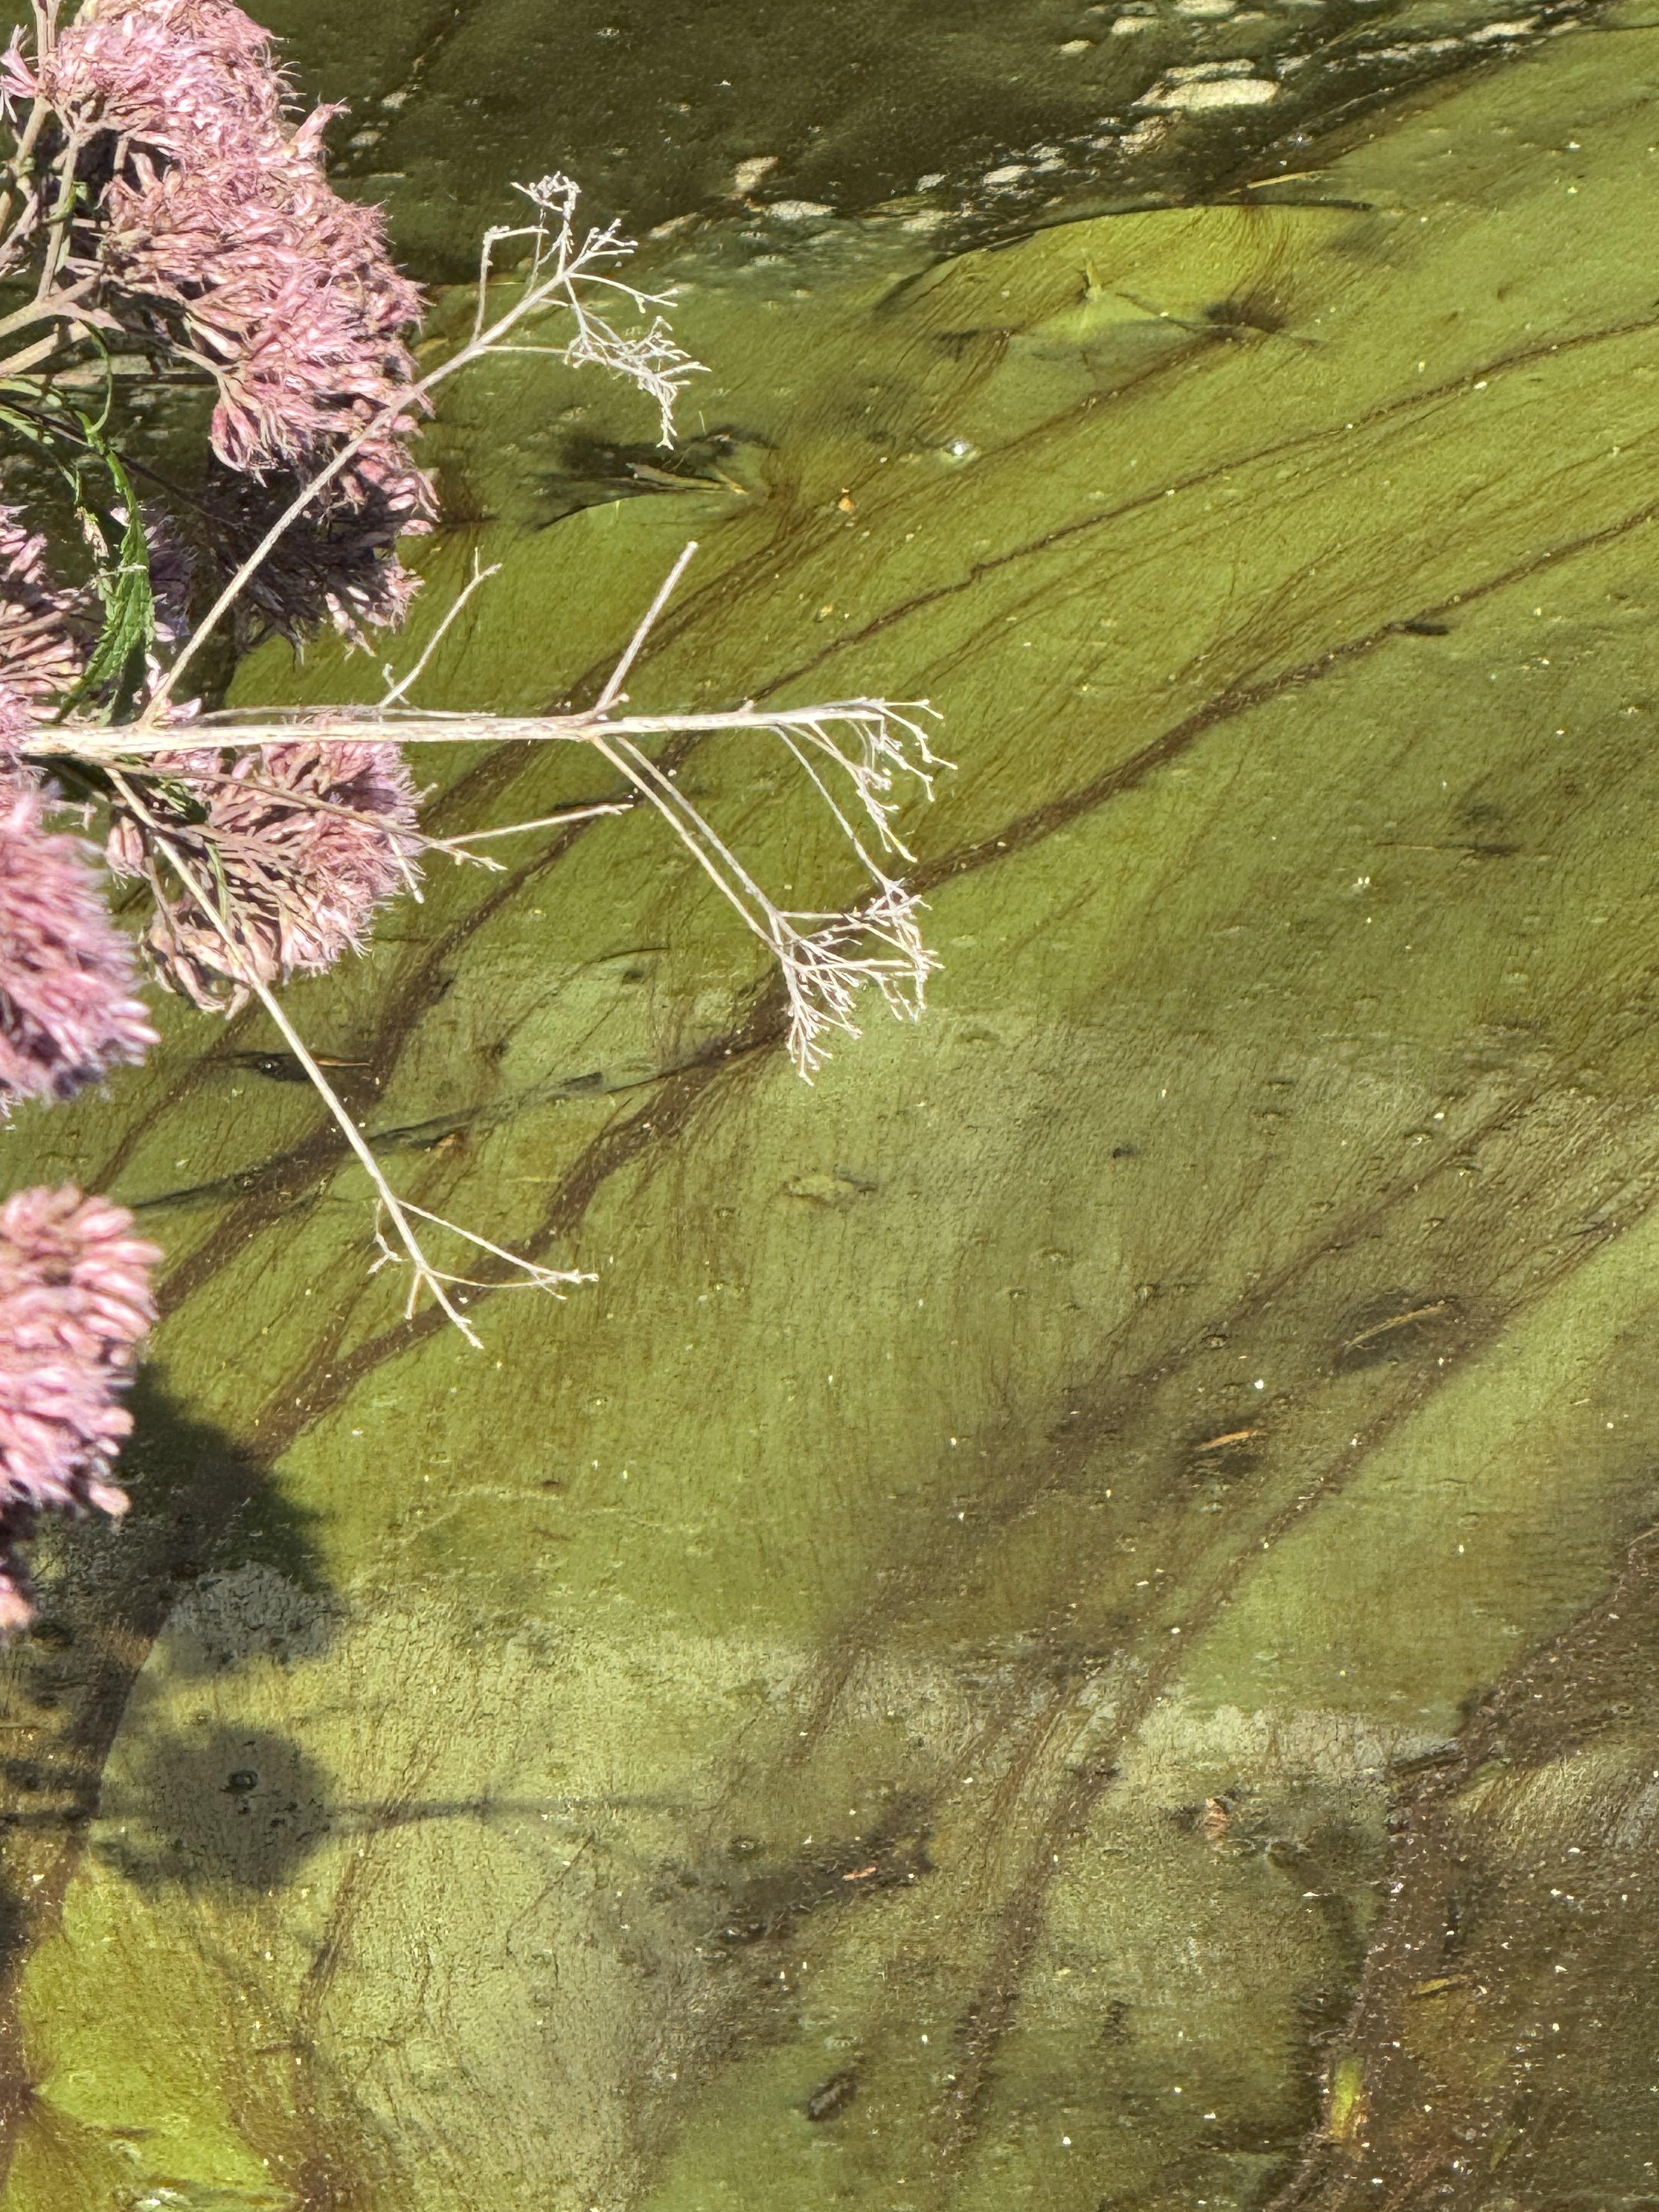
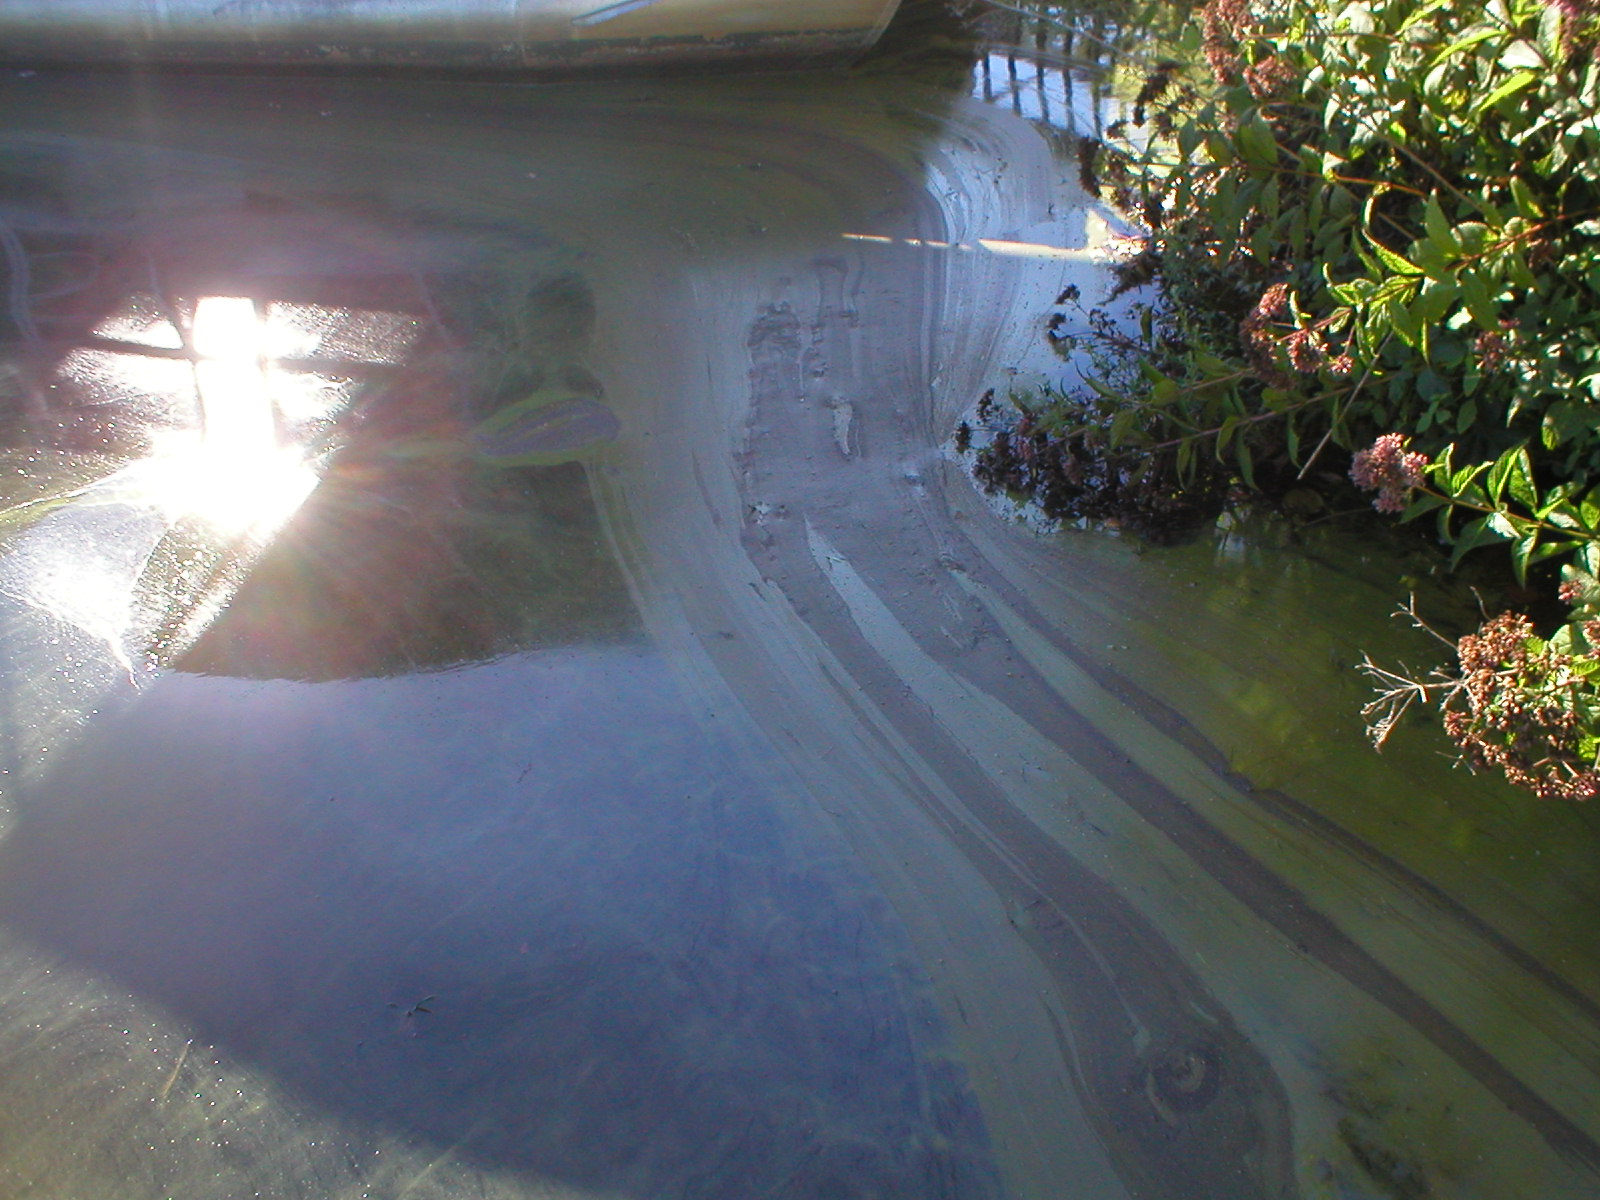
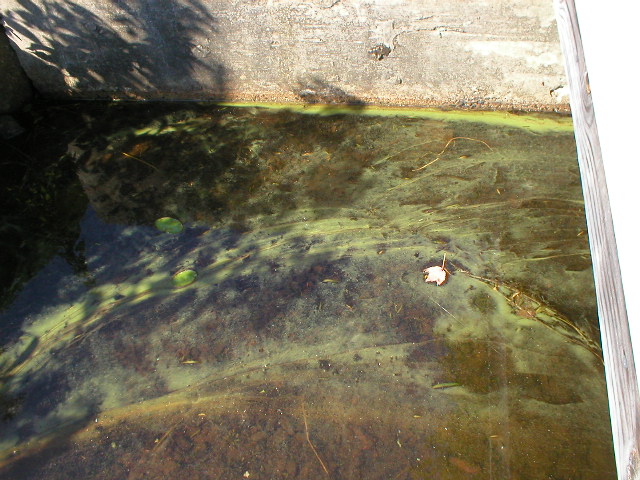
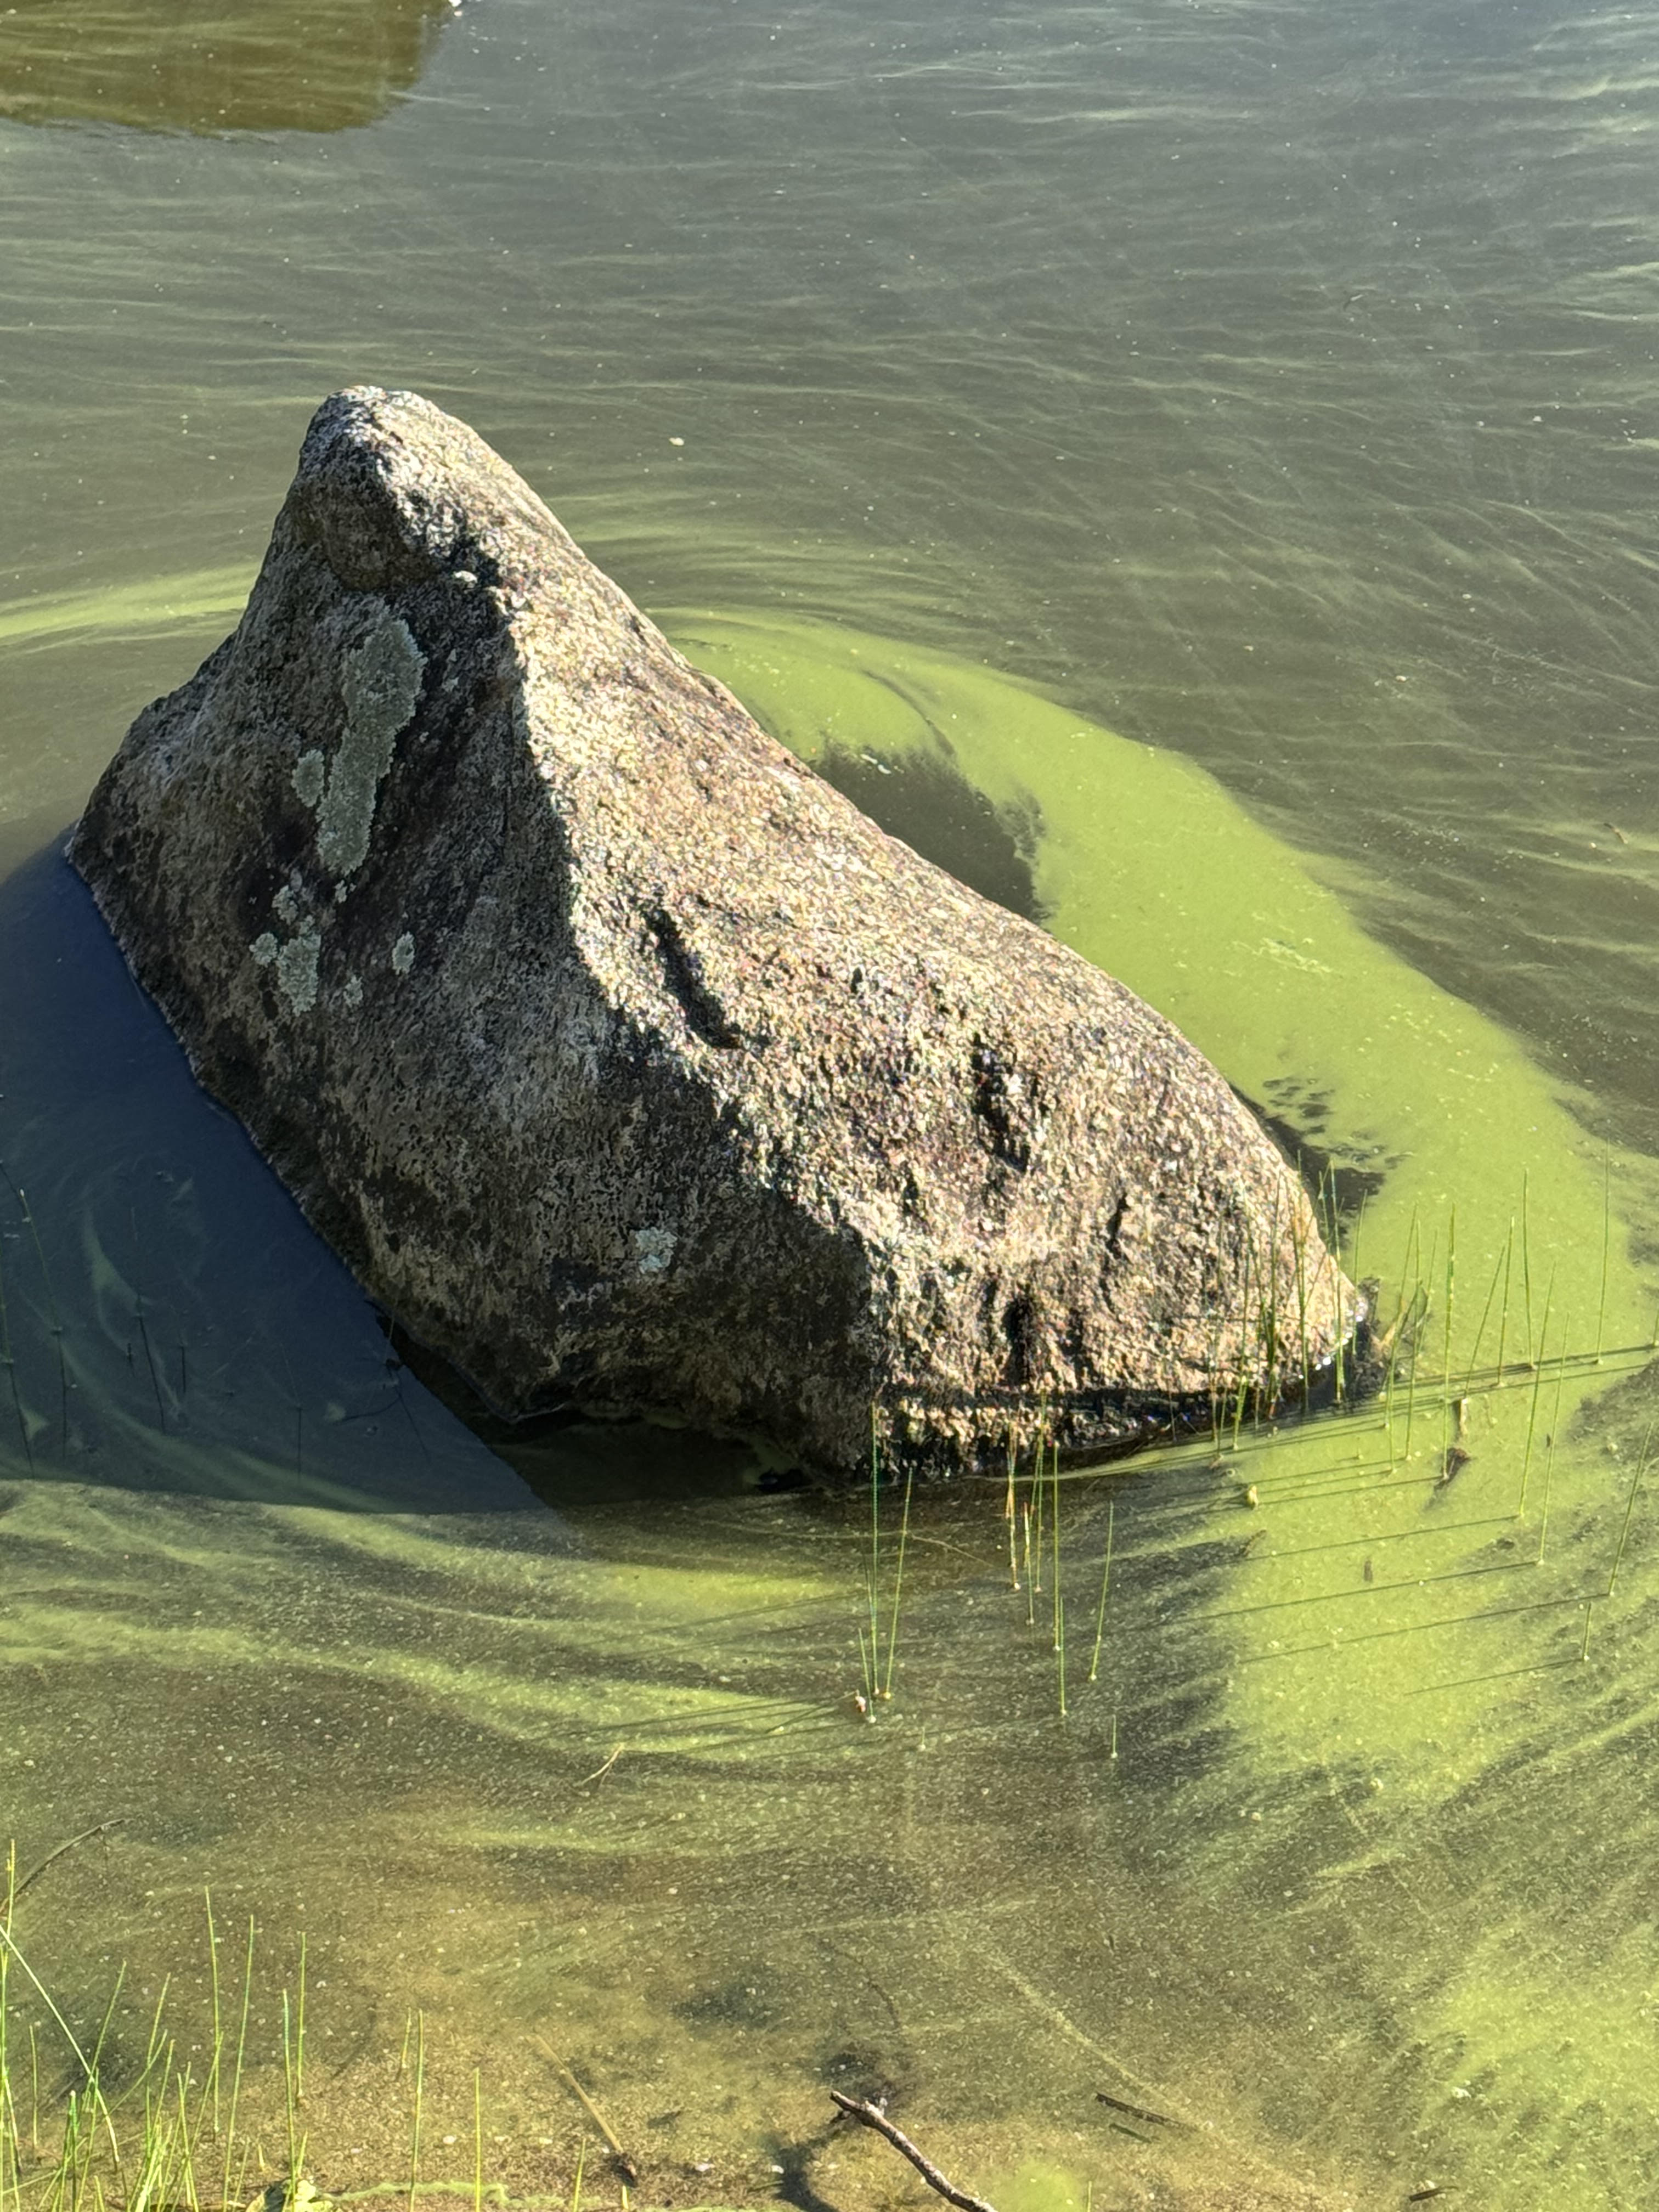
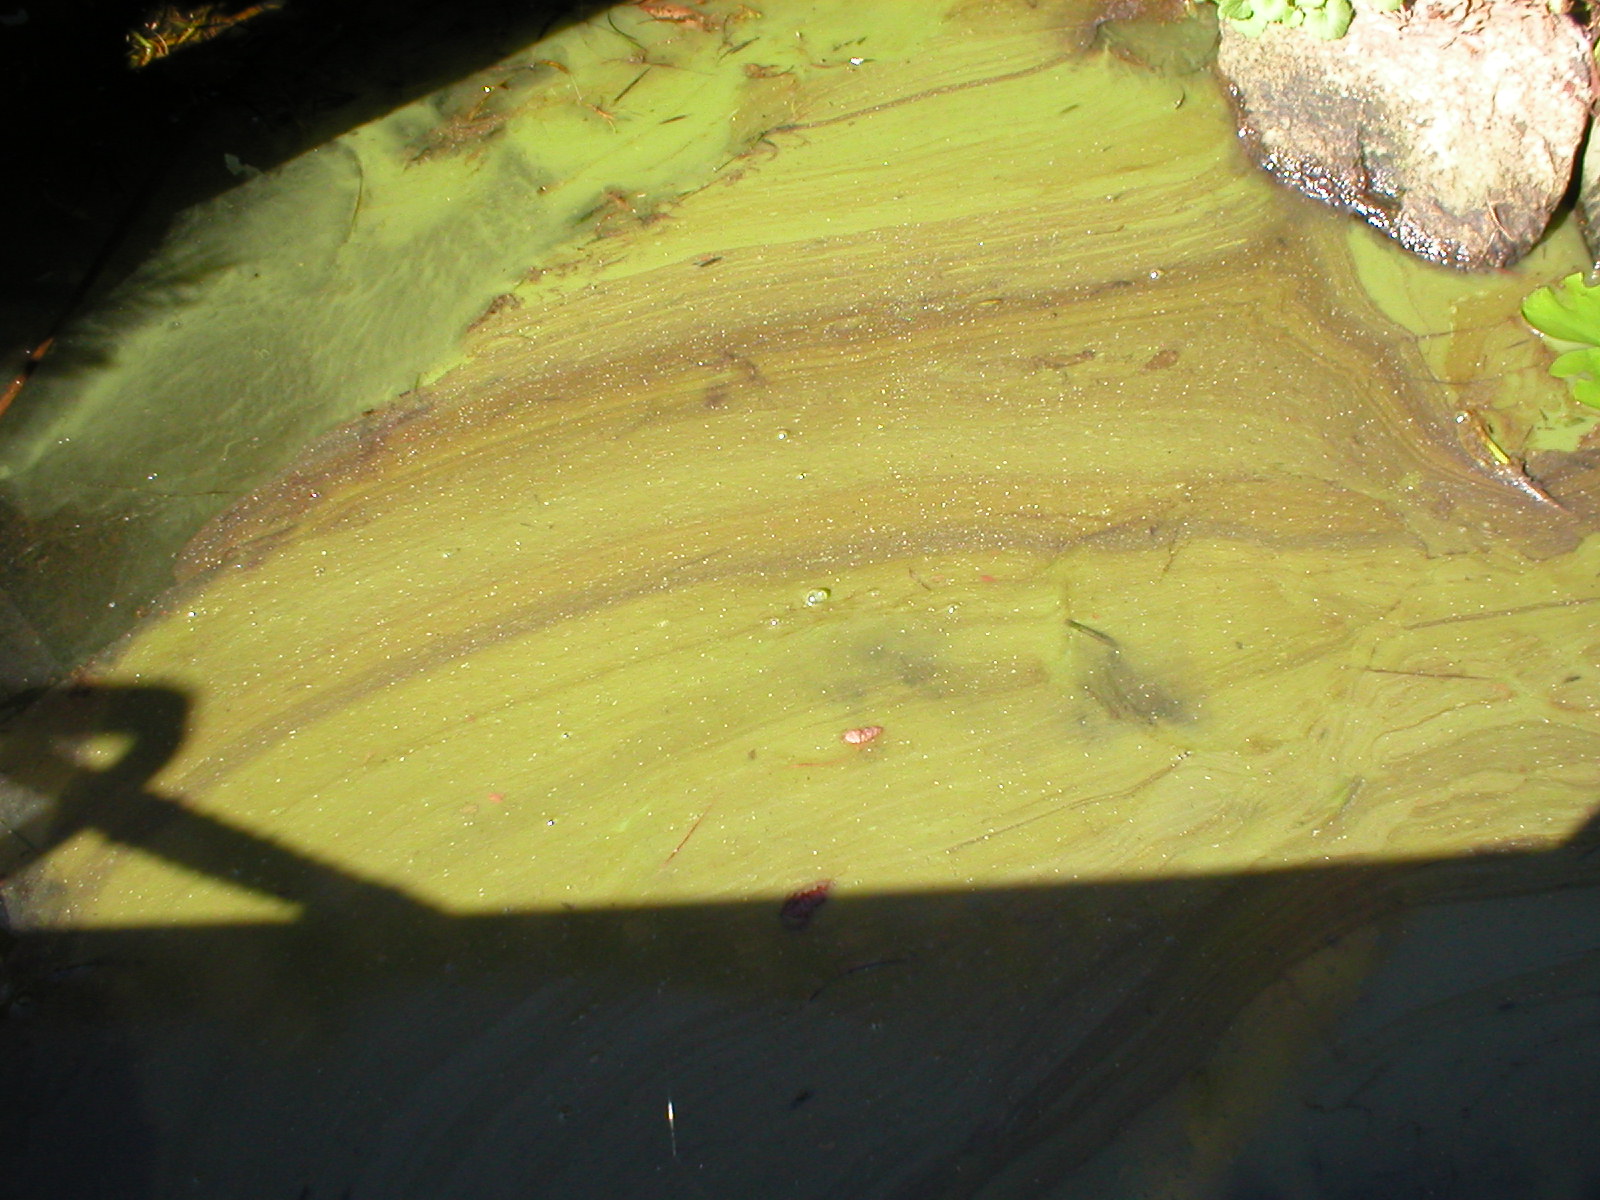
Close-up of cohesive surface film displaying curdled texture.
Mid-cove clarity test demonstrating reduced Secchi visibility.
Downwind wash-up along emergent vegetation beds.
August 6
5 Photos
Distinct paint-spill appearance forming along calm shoreline edges. Suspended cell density remains visible throughout the top foot of the water column.
Late-month surface conditions showing heavy biomass concentration. Scum formation intense along west shore perimeter.
Extensive bloom cover lining the western littoral zone.
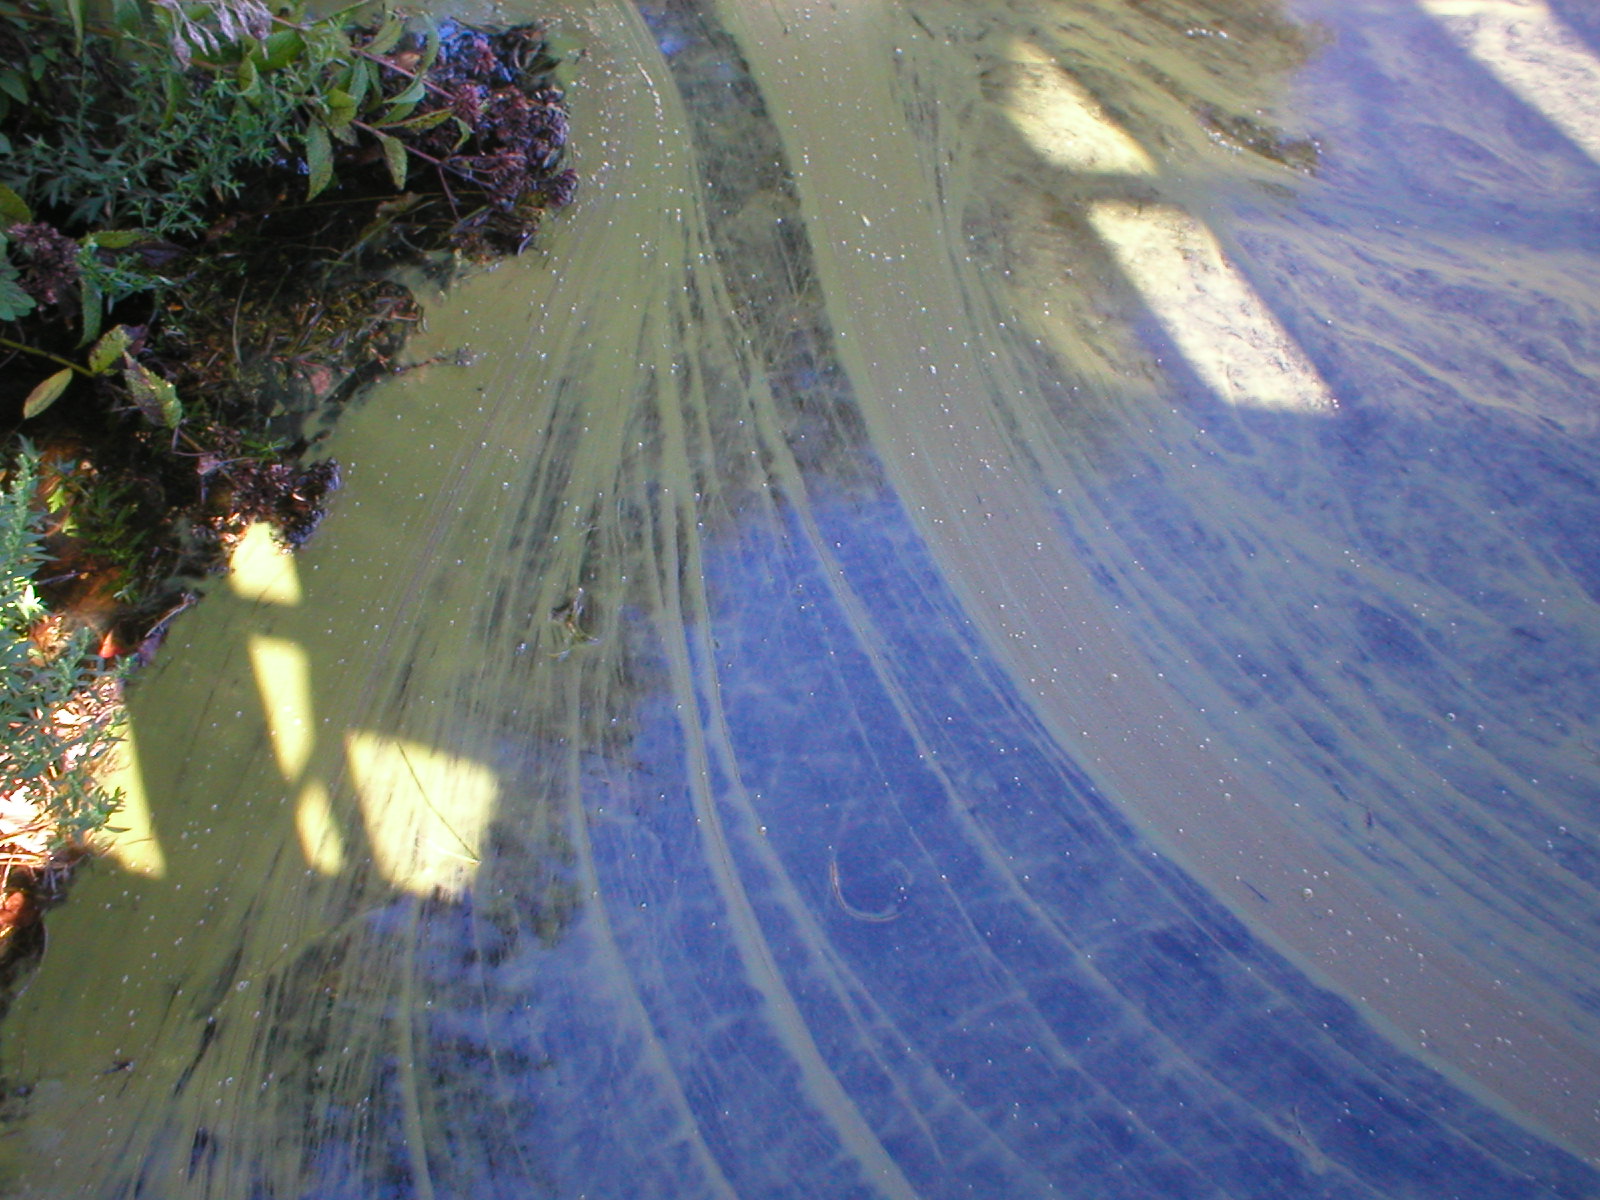
Thick pea-soup consistency coating nearshore water surface.
Early turquoise/blue coloration showing cell breakdown and pigment release.
Border zone where dense scum settles into wetland grass margins.
Thick accumulation surrounding residential dock structure.
August 25
5 Photos
Continued accumulation. Visual indicators consistent with elevated cyanobacteria cell counts; prominent surface scum layers across multiple coves.
Morning calm documenting undisturbed surface crust along shore.
Close inspection of oily/curdled appearance characteristic of bloom.
In-situ clarity test showing zero bottom visibility past 4 inches.
Intermixed decaying plant matter contributing to high surface organic load.
Panoramic stretch demonstrating hundreds of feet of impacted shoreline.
August 30
5 Photos
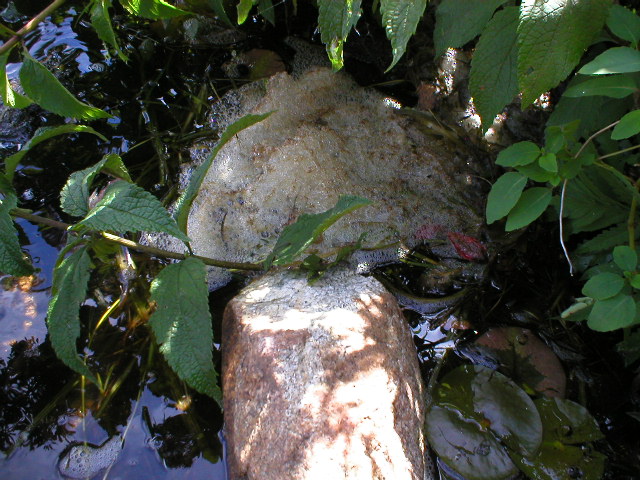
Comprehensive sweep of the west shoreline. Documenting severe continuous scum mats, drying shoreline crust, and distinct blue-green pigment accumulation along the littoral boundary.
West shoreline panorama showing full extent of heavy surface coverage.
Opaque, paint-like layer reaching several inches deep near water line.
Bright turquoise blue pigment (phycocyanin) visible from lysing cells.
Dense accumulation along primary residential dock and ladder entry.
Drying cyanobacteria crust deposited on rocks and bank soil.